
💡 In This Guide:
If you have ever found yourself wondering whether anyone actually visits your website, you are not alone. It is one of the most common questions website owners ask, whether you have a small blog, an online store, or a business site. The good news is that seeing your website traffic is not only possible but also easier than you might think. You do not need to be a technical expert or a data scientist to understand who is visiting your site, where they are coming from, and what they are doing once they arrive.
In this guide, we will walk through everything you need to know about viewing your website traffic. We will cover the tools you can use, the metrics that actually matter, and how to make sense of the numbers so you can grow your online presence with confidence. By the end, you will feel empowered to check your traffic dashboard whenever you want and understand exactly what the data is telling you.
1Ways to See Website Traffic
Before diving into specific tools, it helps to know the different ways you can view traffic. Depending on your goals, you might want to see real-time activity, daily totals, or long-term historical trends. Let us break down the main approaches.
How to Check Website Traffic in Analytics Tools
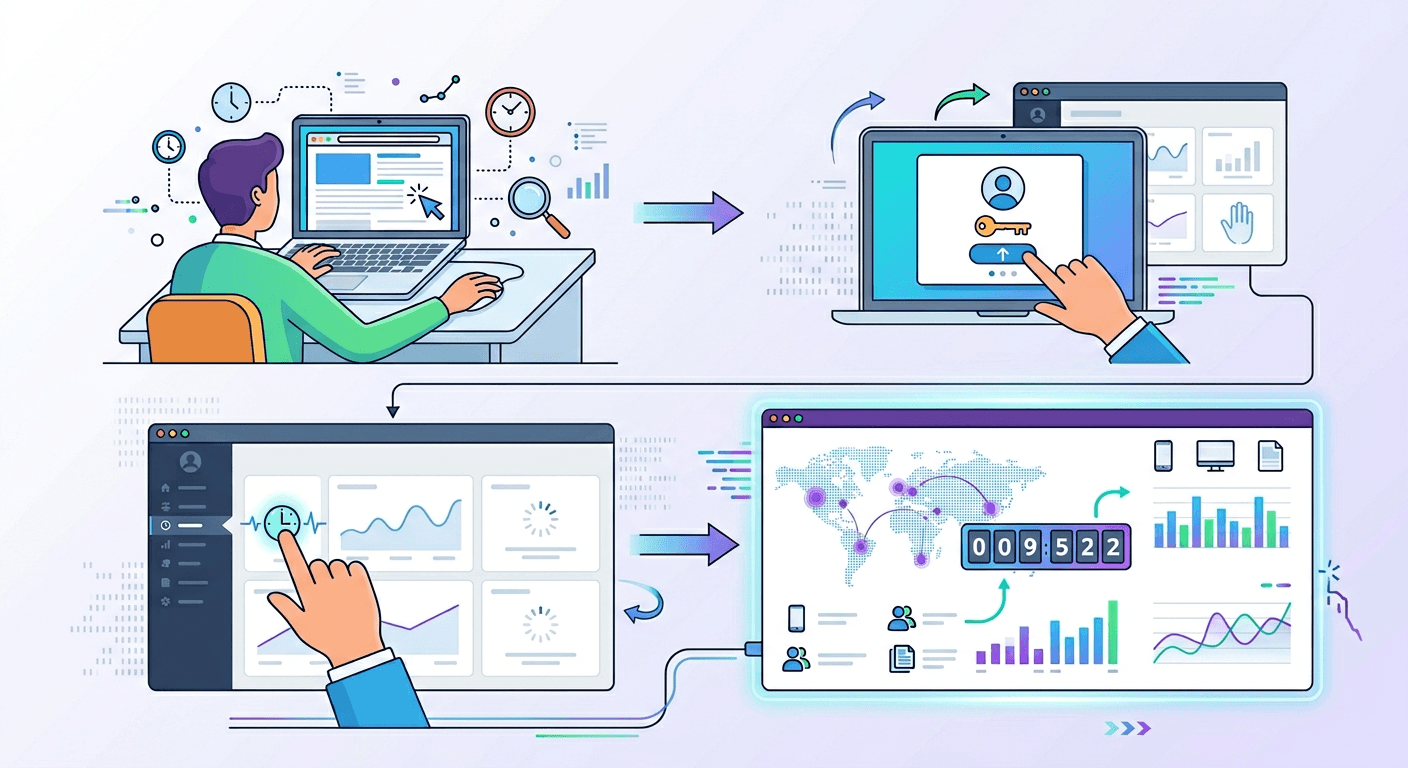
The most reliable way to see your website traffic is by using an analytics platform. These tools place a small piece of code on your site that tracks every visit. Once installed, you can log in to your analytics overview to see detailed reports. The data typically refreshes in real-time or within a few hours, depending on the tool you choose, giving you time-stamped insights into visitor behavior.
Most analytics platforms organize traffic data into clear sections. You can view an overview of total visits, then dig deeper into specific areas like where visitors came from, which pages they viewed, and how long they stayed. The key is to set up your account correctly from the start so you capture accurate information.
How to See Live Visitors on Your Website
Sometimes you want to know who is on your site right now. Live visitors features allow you to see current activity as it happens. You can watch the visitor count increase and decrease throughout the day. Some tools even show you the specific pages people are viewing in that moment, letting you track active users as they navigate your site in real-time.
This real-time feedback helps you understand what resonates with your audience so you can replicate successful tactics.
How to Check Traffic in Real Time
Real-time website traffic tracking goes beyond just seeing how many people are on your site. It shows you minute-by-minute updates on visitor behavior. You can see which traffic sources are sending visitors at that exact moment, whether it is organic search, social media, or a direct link from another site.
For example, if you publish a new blog post and share it on LinkedIn, you can watch the real-time report to see how many people click through within the first hour. You might notice your top active page is your new post, with a peak hour of activity between 3 PM and 5 PM when your audience is most engaged.
How to Track Daily, Weekly, and Monthly Traffic
While real-time views are exciting, daily traffic, weekly traffic, and monthly traffic reports give you the bigger picture. Daily tracking helps you spot patterns in your traffic. You might notice that Tuesdays are your busiest days or that traffic dips on weekends. Weekly reports smooth out daily fluctuations and give you a clearer sense of momentum. Monthly traffic reports show overall growth trends and help you evaluate whether your marketing efforts are paying off.
Most analytics tools let you adjust the date ranges easily. You can view a single day, the past seven days, the past 30 days, or custom ranges that match your business cycles. For example, you might select a custom date range of the last 90 days to analyze longer-term patterns, and then compare it to the previous 30 days as a comparison period. If your traffic change shows +18% with a trend status of upward, you know your efforts are paying off.
Best Tools to Check Website Traffic
Now that you know what to look for, let us explore the tools that make it possible. Each tool offers a slightly different perspective on your traffic, and using a combination of them gives you the most complete picture.
Google Analytics
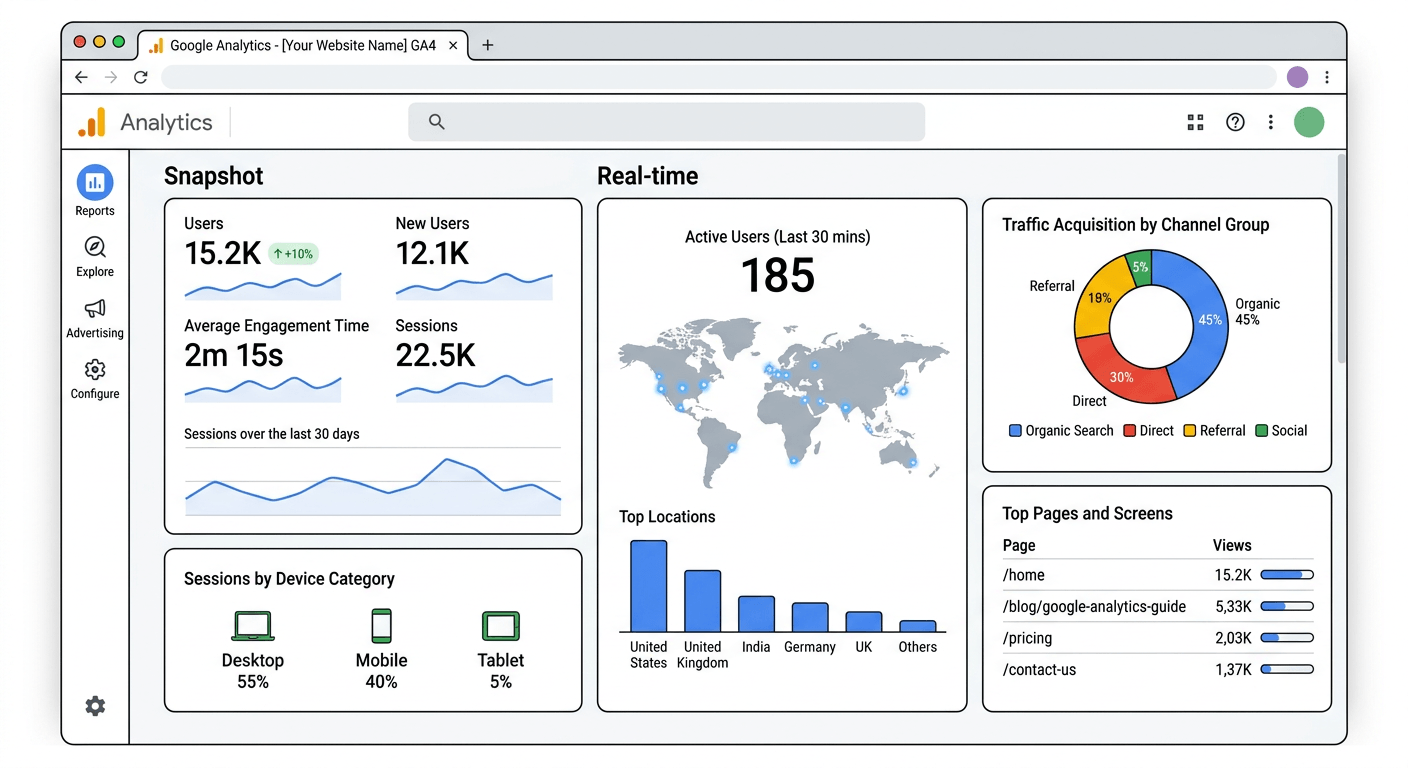
The most widely used website traffic tool. Free, cloud-based, and integrates with other Google services. Tracks every visitor interaction in real-time with a unique measurement ID like G-XXXXXXXXXX. Data freshness is typically real-time, giving you immediate visibility into visitor behavior.
Google Search Console
Focuses specifically on organic search traffic. Shows which search queries bring people to your site, how often your pages appear in search results, and your average position for different keywords. Also alerts you to technical issues that could affect your traffic.
CMS Traffic Dashboards
WordPress, Shopify, and Wix offer built-in traffic tools with simplified dashboards. WordPress users can add analytics plugins directly to their dashboard. Shopify provides e-commerce analytics including sales conversion data alongside visitor numbers.
Competitor Traffic Estimators
Tools like Similarweb, Semrush, and Ahrefs offer estimator-based traffic data for any website. Use these to see which competitor sites attract the most visitors, their top traffic sources, and which pages drive the most engagement.
Heatmap & Behavior Tools
Hotjar, Crazy Egg, and Microsoft Clarity show how visitors interact with your pages. They create visual overlays that highlight where people click, how far they scroll, and which areas get the most attention. Answer questions traditional analytics cannot.
Important Traffic Metrics to Understand
Numbers alone do not tell the full story. You need to know what each metric means and why it matters. Let us walk through the most important traffic metrics and how to interpret them.
Total Users vs Sessions
These two metrics often confuse, but the difference is simple. Users represent individual people who visited your site. If the same person visits five times in a month, they count as one user. Sessions represent individual visits. That same person with five visits counts as five sessions.
Pageviews and Unique Pageviews
Pageviews count every time a page loads. If one person refreshes a page ten times, that counts as ten pageviews. Unique pageviews count each page load by the same person during a single session only once.
Bounce Rate and Engagement Rate
Bounce rate measures the percentage of sessions where a person viewed only one page and then left. A bounce rate of 37% would be considered quite healthy, indicating that most visitors find enough value to explore further.
Google Analytics 4 uses engagement rate instead. An engaged session lasts longer than 10 seconds, includes a conversion event, or involves viewing at least two pages. An engagement rate of 63% means nearly two-thirds of your visitors are interacting meaningfully with your site.
Average Session Duration
This duration-based metric tells you how long visitors stay on your site on average. An average session duration of 2 minutes and 46 seconds suggests visitors are taking time to read your content and explore your offerings. Longer average session duration generally indicates that people are finding your content valuable and engaging.
 AI-generated image, please ignore any text errors.
Pages per Session
Pages per session shows how many different pages a visitor views during a single visit. A pages per session of 2.8 means visitors are looking at nearly three pages each time they visit, suggesting your internal linking and content structure are encouraging exploration.
New vs Returning Visitors
This split tells you whether your audience consists of new users or returning users. A healthy mix is ideal. New users show that your reach is expanding. Returning users show that you have built an audience that wants to come back.
Top Landing Pages
Landing pages are the first pages visitors see when they arrive on your site. Your top landing pages report shows which pages attract the most traffic. For a service business, the top landing page might be /seo-services-karachi/, showing that people are finding your core service offerings through search and referrals.
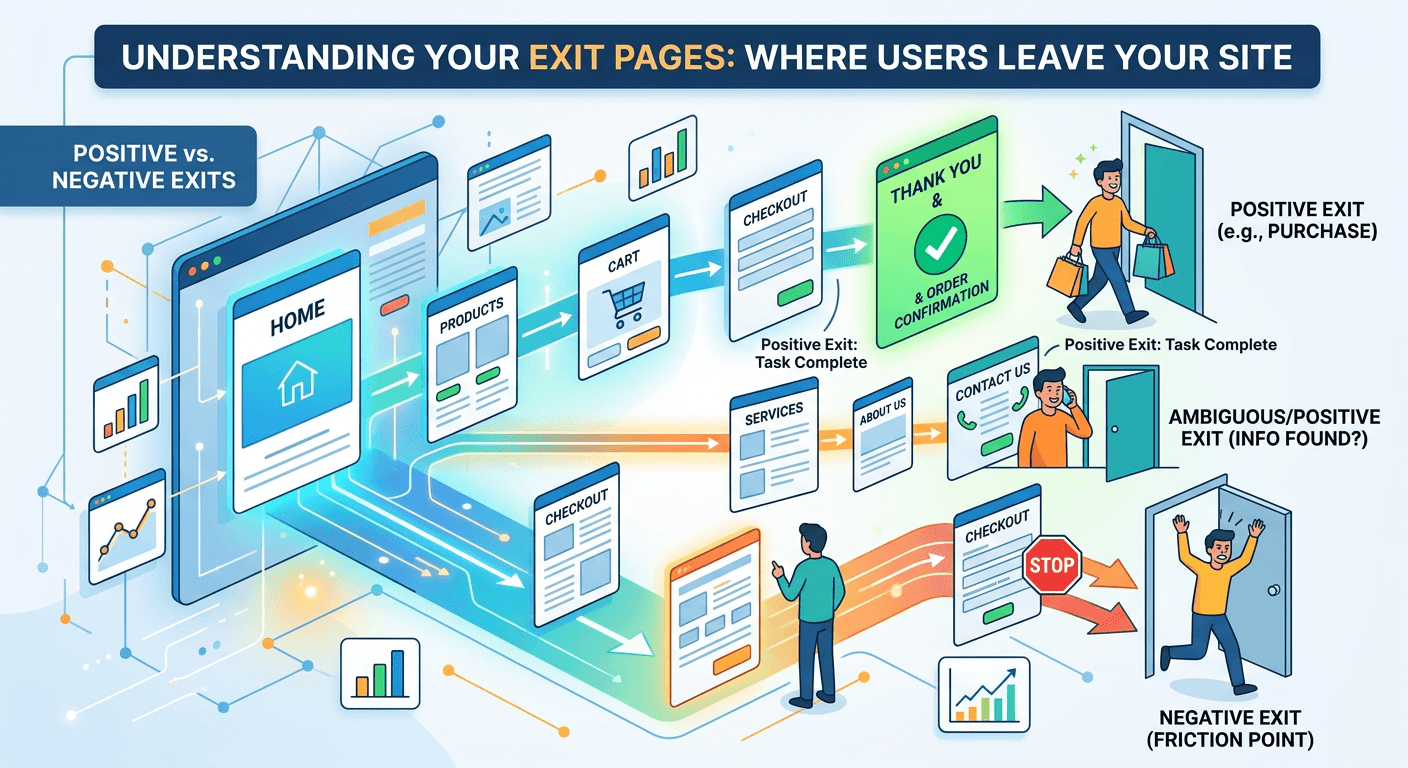
Exit Pages
Exit pages show where people leave your site. Some exits are natural, like a thank-you page after a purchase. Others may indicate friction points. If your top exit page is /contact-us/, it might mean people are leaving after finding your contact information, which could be a positive sign if they plan to reach out offline.
 AI-generated image, please ignore any text errors.
Conversion Traffic Paths
Conversion paths show the sequence of pages visitors view before completing a desired action. A conversion rate from traffic of 4.1% means that out of every 100 visitors, more than 4 complete a desired action like making a purchase or filling out a form. Understanding these conversion-related paths helps you optimize the journey.
Traffic Sources Breakdown
Not all traffic is the same. Understanding where your visitors come from helps you allocate your marketing efforts wisely.
| Traffic Source | Typical Share | What It Means |
|---|---|---|
| Organic Search | 48% | Visitors from Google, Bing, and Yahoo — often your largest and most valuable source |
| Direct Traffic | 21% | Visitors who typed your URL directly or used a bookmark — indicates strong brand recognition |
| Referral Traffic | 12% | From other websites that link to you — benefiting from backlink-generated traffic |
| Social Media | 9% | From Facebook, Instagram, LinkedIn, Twitter, Pinterest, TikTok |
| Paid Advertising | 6% | From ads on search engines or social media — can scale if profitable |
| Email Traffic | 4% | From newsletters and email campaigns — highly engaged subscribers |
Campaign UTM Traffic
UTM parameters are tags you add to the end of URLs to track specific marketing campaigns. You might see a campaign source like newsletter-march with a UTM medium of email, allowing you to track exactly how many visitors and conversions that specific campaign generated.
Best converting source: When evaluating which sources deliver the best results, you might find that the best converting source is organic, meaning visitors who find you through search are most likely to take valuable actions on your site.
Device and Audience Insights
Knowing how visitors access your site and who they are helps you tailor the experience to their needs.
Mobile vs Desktop Traffic
Most websites now receive more traffic from mobile users than desktop users.
If a significant portion of your traffic comes from mobile users but your site loads slowly or is hard to navigate on phones, you are losing visitors.
Browser Traffic Breakdown
Different browser-specific types handle websites differently. Your top browser might be Chrome, with top OS being Android, reflecting the preferences of your audience. Testing your site across these common combinations ensures a smooth experience.
Country and City Traffic
Geographic data shows where your visitors are located. You might see the top country as Pakistan and the top city as Karachi, with the fastest growth region being Dubai. This geographic intelligence helps you tailor content, offers, and even language to your most important markets.
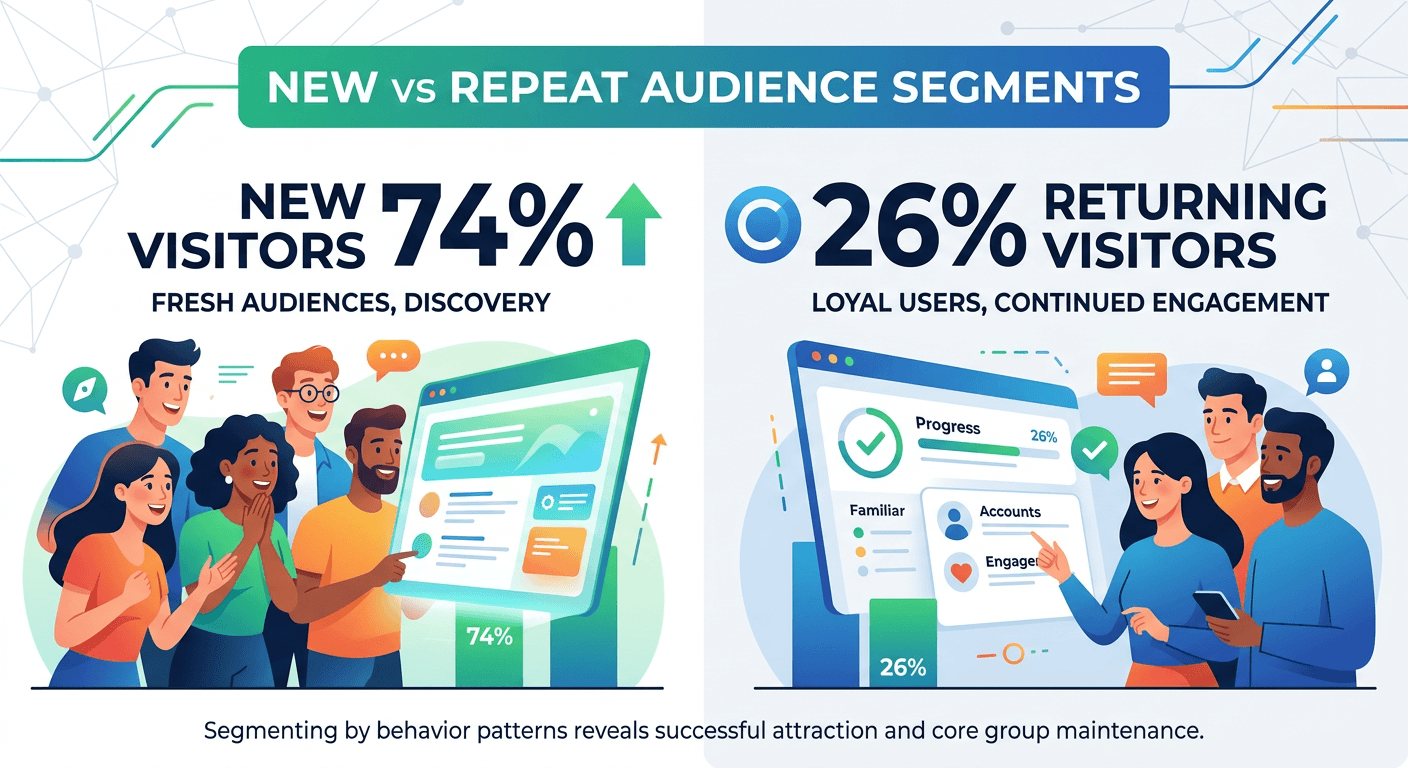
New vs Repeat Audience Segments
Segmenting your audience by new visitors versus returning visitors reveals different behavior patterns. With new visitors at 74% and returning visitors at 26%, you are successfully attracting fresh audiences while maintaining a core group of loyal users.
 AI-generated image, please ignore any text errors.
Traffic by Demographics
Demographic-based data includes age, gender, and interest-based user interests when available. Understanding your audience demographics and user interests helps you create content and offers that resonate with their preferences.
Behavior by Device Type
Visitors behave differently on different device-category types. Your highest engagement device might be desktop, meaning desktop visitors spend more time and view more pages than mobile users. Meanwhile, your top audience segment could be organic mobile users, showing that mobile visitors who find you through search are your most valuable group.
How to Know if Traffic is Growing
Traffic growth is rarely a straight line. Understanding patterns helps you celebrate real progress and avoid overreacting to normal fluctuations.
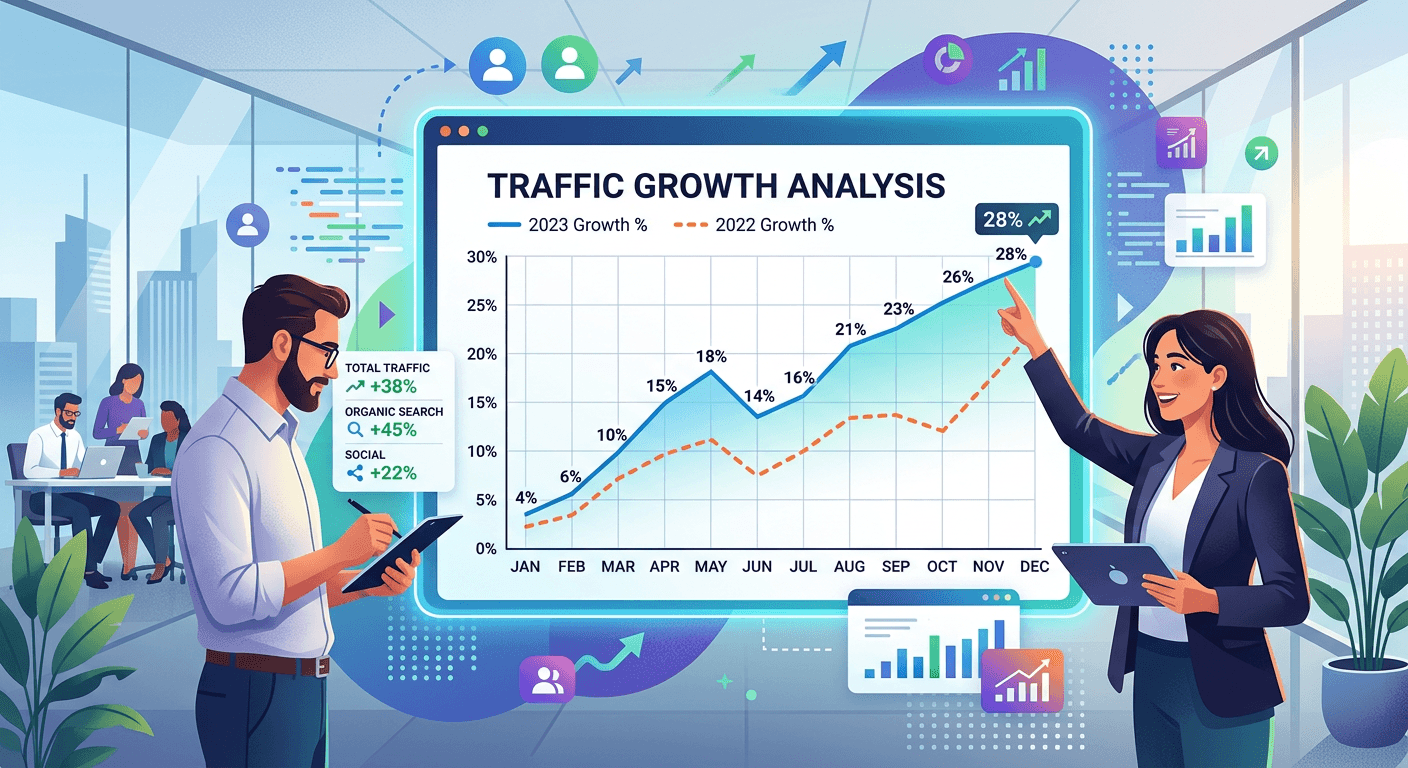
Month over Month Growth
Month-over-month traffic comparisons show short-term trends. You might see month-over-month growth of +22%, a strong indicator that your recent marketing efforts or content improvements are paying off. Compare the current month to the previous period to spot these changes.
 AI-generated image, please ignore any text errors.
Year-over-Year Comparisons
Year-over-year traffic comparisons account for seasonal patterns. A year-over-year growth of +41% shows that your long-term strategy is working, even when accounting for seasonal fluctuations. This kind of sustained growth builds a strong foundation for your business.
Seasonal Fluctuations
Most websites experience predictable patterns of seasonal traffic. You might see a seasonal increase labeled as Ramadan campaign uplift, showing that your targeted seasonal content or promotions are resonating with your audience during specific times of the year.
Traffic Spikes and Drops
Unexpected spike-driven traffic increases and drop-based traffic decreases warrant investigation. A spike date of March 12 might correspond to a viral social media post or a mention in a popular publication. A traffic drop date of March 18 might indicate a technical issue or a lost backlink. When you notice these changes, dig into what caused them.
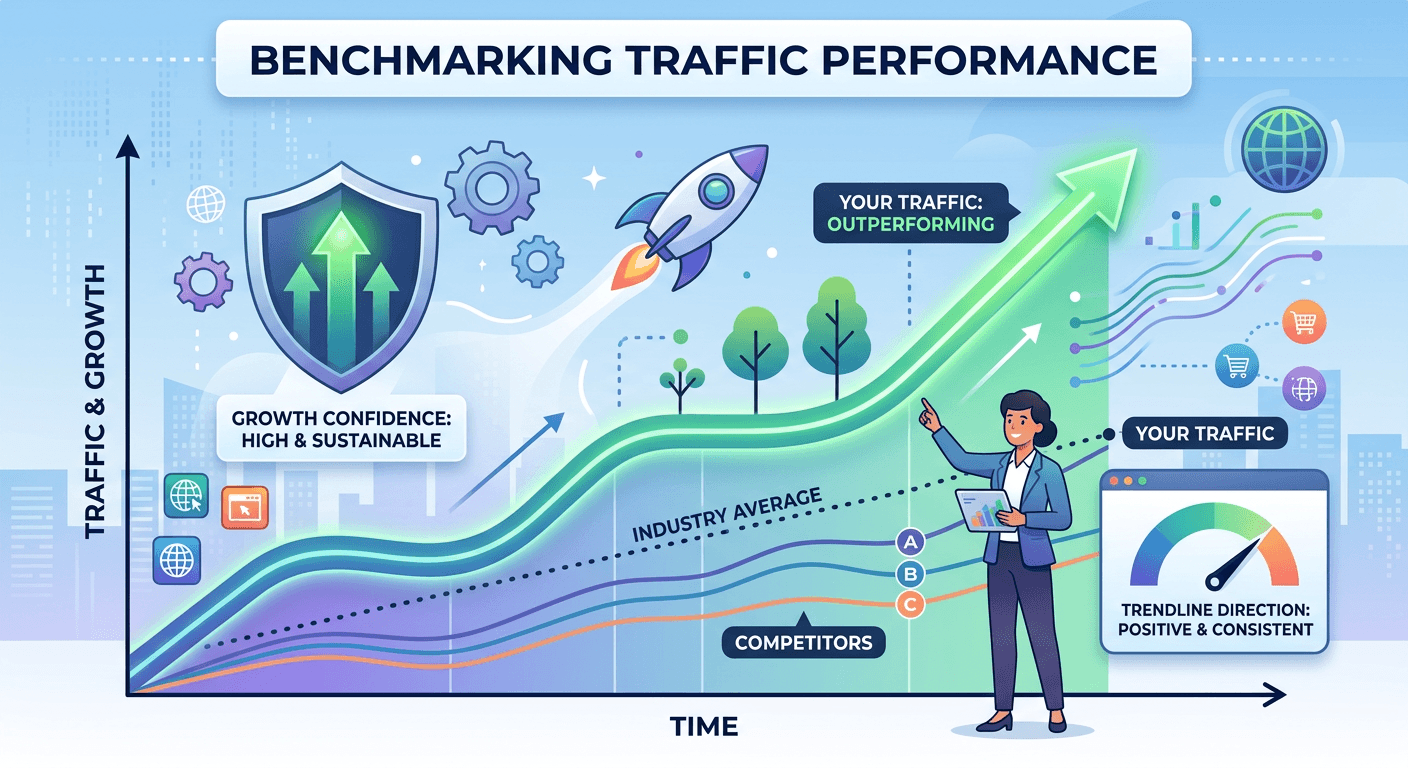
Benchmarking Traffic Performance
Benchmarking means comparing your traffic to benchmarked data or your own historical best. If your benchmark status shows above industry average, you are outperforming competitors in your space. Your trendline direction might be positive with growth confidence showing consistent, meaning your traffic gains are sustainable rather than one-time spikes.
When analyzing anomalies, you might identify an anomaly type as a viral referral spike, which is exciting but may not be sustainable. Use these insights to capitalize on opportunities while maintaining steady weekly growth of perhaps +8% from more reliable sources.
 AI-generated image, please ignore any text errors.
How to Interpret Traffic Quality
More traffic is not always better traffic. Understanding quality helps you focus on visits that actually move your business forward.
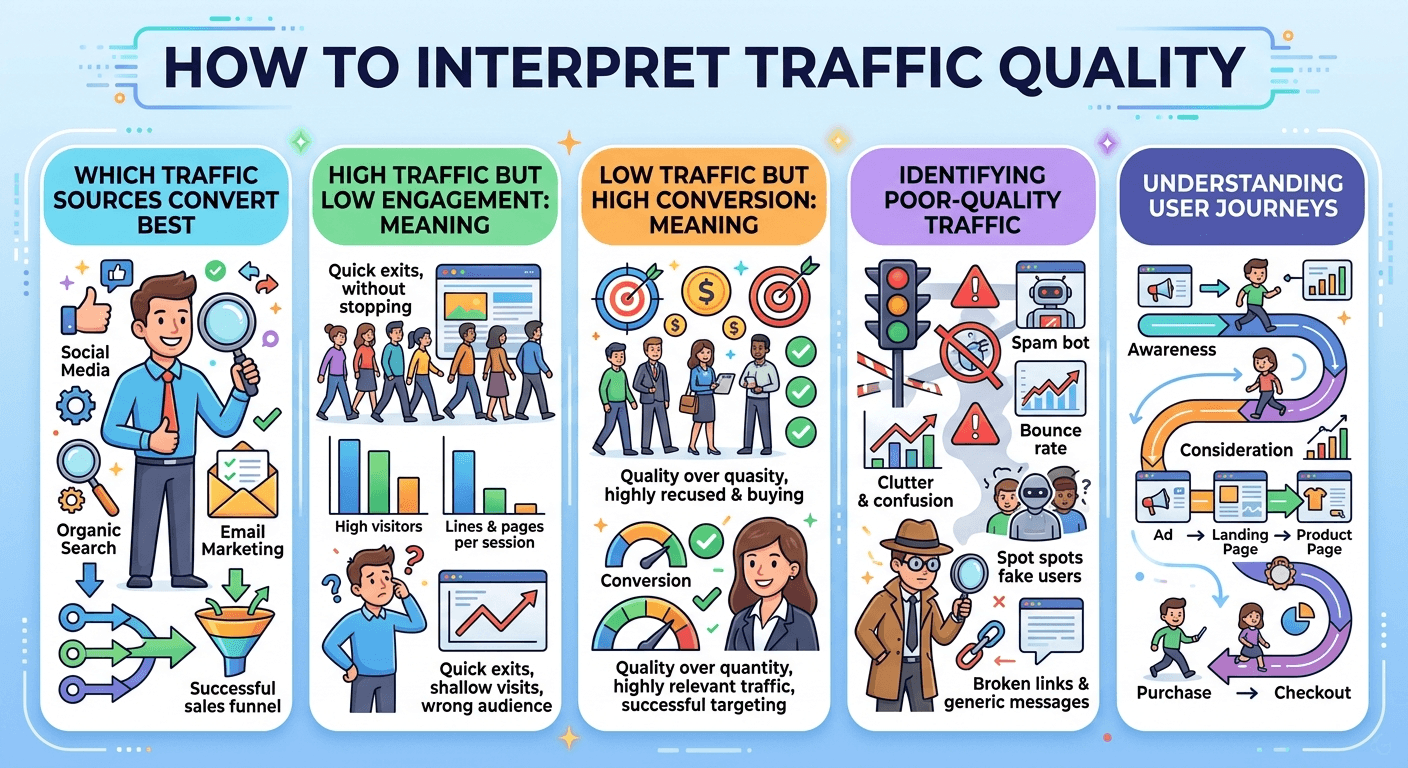
Which Traffic Sources Convert Best
Look at your conversion data alongside traffic sources. You might find that a high-quality source is organic search, while a low-quality source might be spam referrals that inflate your numbers without delivering value. Identify your top-performing sources and allocate more resources to them.
High Traffic but Low Engagement: Meaning
If a page receives high traffic but has low engagement, visitors are not finding what they expected. This could happen if your title and meta description promise something that your content does not deliver. A low-intent page, like a blog archive, might attract visitors who quickly leave because they were looking for specific information rather than a collection of posts.
Low Traffic but High Conversion Meaning
A page with low traffic but high conversion is a hidden gem. A high-intent landing page, like a pricing page, might have lower traffic but exceptionally high conversion rates because visitors who reach that page are already considering a purchase. This page is a candidate for promotion.
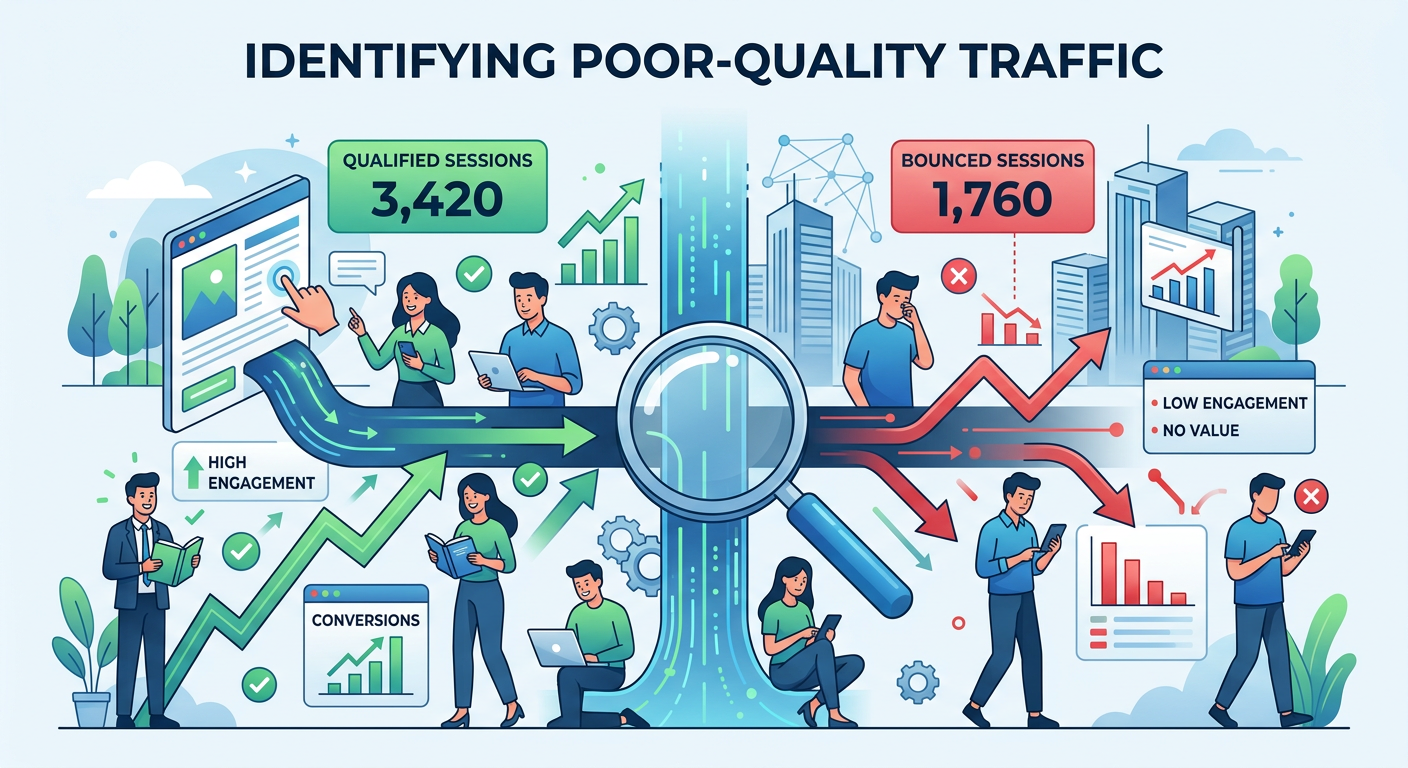
Identifying Poor-Quality Traffic
Not all traffic benefits your site. Low-quality traffic includes visitors who leave immediately, do not engage with your content, and never convert. You might have qualified sessions numbering 3,420 and bounced sessions numbering 1,760. A high number of bounced sessions suggests some of your traffic is not finding what they need.
 AI-generated image, please ignore any text errors.
Recognizing Bot or Spam Traffic
Bot-generated and spammy traffic can inflate your numbers. You might detect bot traffic share of 2%, with spam traffic detected marked Yes. These sources can skew your data, but filtering them out gives you a clearer picture of real human visitors.
Understanding User Journeys
The path visitors take before converting reveals a lot about traffic quality. Your best conversion path might be blog → service page → contact, showing that visitors who first engage with your educational content are most likely to eventually reach out. If you have assisted conversions of 128, that means over 100 conversions were influenced by multiple touchpoints rather than a single click.
An exit-heavy source like paid social might send many visitors who leave quickly, suggesting your ad targeting or landing page needs adjustment. Meanwhile, an engagement depth of 75% scroll on your key pages indicates visitors are thoroughly consuming your content.
Beginner Setup Guidance
If you are just starting, getting your traffic tracking set up correctly is essential.
How to Install Analytics Code
Most analytics tools provide a small piece of JavaScript code called a tracking code or analytics script. You need to place this tracking code on every page of your website. The best place is in the header section of your site, before the closing tag, with script placement set to header.
If you use a content management system, look for a section to add code to the header. Many themes and plugins have a designated area for tracking code. Your installation method might be a plugin, which simplifies the process significantly.
Where to Place Tracking Scripts
The analytics script should load early on each page so it can capture visitor activity. Placing it in the header section ensures it loads before the rest of the page content. If you use a tag manager, you can manage multiple tracking scripts from one container instead of editing your site code directly.
For Google Analytics 4, you will use a measurement tag that contains your measurement ID. Your property type is GA4, and your data stream type is web, configured for standard website tracking.
How Long Does Data Take to Appear
After installing your tracking code, data does not appear instantly. Most analytics tools take 24 to 48 hours to start showing data, with a reporting delay of 24 hours max for standard reports. Real-time reports may show activity within minutes.
Common Setup Mistakes
Common mistakes include placing the tracking code in the wrong location, installing it twice, or forgetting to add it to all pages. Another mistake is not setting up goals or conversions from the start. With goals configured for form submission, you can track how many visitors complete valuable actions. Your event setup might include scroll + click to capture deeper engagement.
Take time to test your tag installation. Your verification status should show successful, confirming that everything is working correctly and is active. Your integration platform might be WordPress, making it easy to manage your tracking alongside your content.
Troubleshooting Missing Traffic Data
Sometimes, traffic data does not show up as expected. Here is how to diagnose common issues.
Why Analytics Shows Zero Visitors
If your analytics shows missing traffic data or a zero traffic issue, the tracking code may not be correctly installed. Use your browser's developer tools to check whether the analytics script loads. The issue status might show zero traffic, with the script state showing missing.
Another possibility is that you have filter settings that exclude your own IP address, and the filter is too broad. Check your view filter settings to ensure you are not filtering out all traffic, leaving you with filtered-out data.
Tracking Code Not Firing
Sometimes the tracking code exists on your site but is inactive or does not fire. This can happen if another script conflicts with it or if your site uses a consent banner with cookie settings that block tracking until users accept. A consent issue might show cookie rejected as the reason for missing data.
Test your site in incognito mode to see if the issue relates to your own cookie settings and consent banner interactions. If the code fires for incognito users, the problem is likely on your end rather than with visitors.
Duplicate Tags
Having duplicated tags can also cause problems. If your tracking code fires twice, it can inflate your numbers or cause data sampling issues. A duplicate tag count of 2 means each visit is being counted twice, skewing your data.
 AI-generated image, please ignore any text errors.
Filters Removing Data
Filters in Google Analytics can accidentally remove data you want to keep. If you set up a filter to exclude internal traffic, ensure you use the correct IP address format. If your IP changes, your filter settings may start blocking external traffic, leaving you with filtered-out data. Review your filter settings periodically to confirm they are working as intended.
Consent Mode Issues
Privacy regulations require that you obtain consent from visitors before tracking them in many regions. If your consent banner and cookie settings are misconfigured, it may block tracking for all visitors, resulting in consent-restricted data collection. Test your site from a location with strict privacy laws to see if tracking works as expected. Adjust your consent banner and cookie settings to balance compliance with data collection.
Ad Blockers and Browser Privacy Restrictions
Some visitors use ad blockers that also block analytics scripts, causing blocked data collection. You might see an ad blocker effect as a partial loss, meaning some of your traffic is not being recorded. Industry studies suggest that 20 to 30 percent of users use ad blockers.
Similarly, browser privacy restrictions in Safari and Firefox can limit tracking. Focus on trends rather than absolute numbers. Even with some blocked tracking, you can still measure growth and engagement effectively.
Technical Implementation Issues
Other issues can include data lag, especially during high traffic periods or after making configuration changes. You might experience data lag of up to 48 hours before new data appears. Server-side rendering issues and cache conflicts can prevent your tracking code from loading properly. A cache issue that is resolved will restore tracking once cleared.
JavaScript errors elsewhere on your page can also stop your analytics script from executing. If a JavaScript error shows a tag blocked, you need to fix the underlying code conflict. Once fixed, your fix result should show tracking restored.
| Problem | Likely Cause | Fix |
|---|---|---|
| Zero visitors showing | Tracking code missing or mis-placed | Check header for analytics script using browser dev tools |
| Code exists but not firing | Script conflict or consent banner blocking | Test in incognito mode; check cookie settings |
| Inflated numbers | Duplicate tags installed | Audit tag manager or source code for double installs |
| Data disappearing | Filter misconfiguration | Review and update IP exclusion filters |
| All visitors blocked | Consent mode misconfigured | Test from strict-privacy region; adjust consent settings |
| Partial data loss | Ad blockers (20–30% of users) | Focus on trends, not absolute numbers |
| Data lag | High traffic or cache conflict | Clear cache; allow up to 48 hours for reports to refresh |
SEO Connection to Traffic
Search engine optimization directly influences how many visitors find your site through organic search.
How Rankings Influence Traffic
Higher rankings generally lead to more traffic. The top three organic search results receive the majority of clicks. Research shows that the first result gets about 28 percent of clicks, the second gets about 15 percent, and the third gets about 11 percent. By the tenth result, click-through rate drops below 3 percent.
Improving your rankings from page two to page one can dramatically increase your traffic. Each position you move up has a significant impact on search impressions and clicks.
Which Pages Bring the Most SEO Visits
Your ranking pages in Google Search Console show which content performs best in organic-focused search. You might have impressions of 48,000 and clicks of 3,920, giving you a CTR of 8.1% with an average position of 6.4. Your top keyword might be seo services in Karachi, showing what people are searching for to find you.
Your best SEO landing page might be a service page, while your top-ranking page could be your homepage. With indexed pages totaling 142, you have a substantial footprint in search results.
Impression vs Click Differences
Search impressions count how many times your page appeared in search results. Clicks count how many times someone actually visited. A high impression-based count with a low click-through rate suggests your title and meta description are not compelling enough. Improve these elements to encourage more searchers to choose your listing.
Branded vs Non-Branded Keywords
Branded traffic comes from searches that include your business name or brand terms. You might see branded traffic at 32% and non-branded traffic at 68%. Branded traffic indicates that people already know about you. Non-branded traffic shows that people are discovering you through their research on topics and problems you address.
Reporting and Decision Making
Collecting traffic data is only valuable if you use it to make better decisions.
How Often to Review Traffic
The frequency of reviewing traffic depends on your goals. Daily checks are useful during campaigns or when you are testing changes. Weekly reports help you spot patterns without overreacting to daily fluctuations. Monthly reports give you the clearest picture of overall trends. Set a scheduled regular review that works for you. Your reporting frequency might be weekly, giving you a consistent cadence for monitoring performance.
Which KPIs Matter for Small Businesses
Key performance indicators vary by business type. Your top KPI might be organic sessions, especially if search traffic drives your business. A benchmark result showing +15% above target means you are exceeding your goals.
Building a Traffic Reporting Dashboard
A customizable dashboard brings your most important metrics into one view. Your dashboard type might be executive KPI, focusing on the high-level metrics that matter most to leadership. A custom dashboard for traffic + leads combines acquisition and conversion data for a complete picture.
Include your top KPIs, a traffic source breakdown, your best landing pages, and a trend chart showing growth over time. Your export format might be PDF for sharing, and your presentation format might be a monthly slide deck for team meetings.
Sharing Reports with Clients or Teams
If you manage a website for a client or work with a team, clear reporting builds trust. Your report audience might be the client / internal team, requiring clear explanations and actionable insights. Use simple language and visual charts. Avoid dumping raw data. Highlight the insights that matter most for decision making. Stakeholder reports and client-ready reports should include an executive-level summary that answers the most important questions upfront.
Advanced Insights
For those ready to go deeper, advanced analysis reveals the nuances of visitor behavior.
Cohort Traffic Behavior
Cohort-based analysis groups visitors by the time they first visited. Your top cohort might be first-time organic users, showing that people who discover you through search tend to have the highest long-term value. A repeat visit rate of 22% with a retention window of 30 days tells you how well you keep visitors coming back.
User Journey Paths
Path-oriented reports show the sequence of pages visitors follow. Your user flow winner might be your service pages, where visitors who land on these pages tend to explore further. The top conversion path might be organic → blog → service, showing that educational content leads to business inquiries.
Assisted Conversions
Assisted conversions track marketing channels that contribute to conversions, even if they were not the final touchpoint. You might have assisted conversions of 128 with assisted revenue equivalent to $4,800, showing the hidden value of channels that introduce visitors to your brand.
Attribution Models
Attribution-driven models determine how credit for conversions is assigned to different touchpoints. The best attribution model might be data-driven, which uses machine learning to distribute credit based on actual contribution rather than simple rules.
Funnel Drop Off Traffic Analysis
If you have a defined funnel, such as homepage to product page to cart to checkout, funnel-specific analysis shows where people leave. Your funnel completion rate might be 14%, with the main drop-off step being your pricing page. A 10 percent improvement in drop-off-aware rates can significantly increase overall conversions.
Multi-touch paths analysis shows how different channels work together across conversion funnels. You might discover that certain combinations of channels lead to higher assisted revenue than others.
Frequently Asked Questions
The easiest way is to install Google Analytics. It is free and provides a comprehensive dashboard showing total visitors, where they came from, which pages they viewed, and how long they stayed. If you use WordPress or Shopify, built-in analytics plugins and dashboards offer even simpler access to basic traffic data without technical setup.
Most analytics tools take 24 to 48 hours to start showing standard reports. Real-time reports may show activity within minutes of installation. If you see no data after 48 hours, use your browser developer tools to check whether the analytics script is loading correctly on your pages.
Users represent individual people who visited your site. If the same person visits five times in a month, they count as one user. Sessions represent individual visits — that same person with five visits counts as five sessions. In a typical month, you might see total users of 5,240 and sessions of 6,810, meaning the average visitor comes back about 1.3 times.
The most common reasons are: the tracking code is not correctly installed or is missing from some pages, a consent banner is blocking tracking until visitors accept cookies, a filter is accidentally excluding all traffic, or there is a JavaScript conflict preventing the script from firing. Test your site in incognito mode and use browser developer tools to verify the analytics script loads correctly.
A bounce rate of 37% would be considered quite healthy, indicating that most visitors find enough value to explore further. Blog posts and news articles naturally have higher bounce rates. Google Analytics 4 uses engagement rate instead — an engagement rate of 63% means nearly two-thirds of your visitors are interacting meaningfully with your site.
In Google Analytics, navigate to the Acquisition section to see a full breakdown of traffic sources. In a typical breakdown, organic traffic might account for 48% of all visits, direct traffic 21%, referral 12%, social 9%, paid 6%, and email 4%. UTM parameters added to campaign URLs give you even more granular tracking of specific campaigns.
You cannot access exact data from a competitor's private analytics account, but third-party estimator tools like Similarweb, Semrush, and Ahrefs provide estimated traffic data for any website. These estimates give you a sense of relative performance, top traffic sources, and which pages drive the most engagement.
Let Webperts Help You See Your Traffic Clearly
Understanding your website traffic is one thing, but knowing what to do with that information is where real growth happens. Whether you are just starting and need help setting up your analytics correctly, or you have years of data but struggle to interpret what it means, Webperts provides the expertise you need. The Webperts team does not just hand you a dashboard full of numbers — they dig into the data to uncover insights that matter to your specific business. They identify which traffic sources drive your best customers, which pages need improvement, and where hidden opportunities are waiting.
Submit Your Site for a Free Audit →Learn more about Webperts SEO services