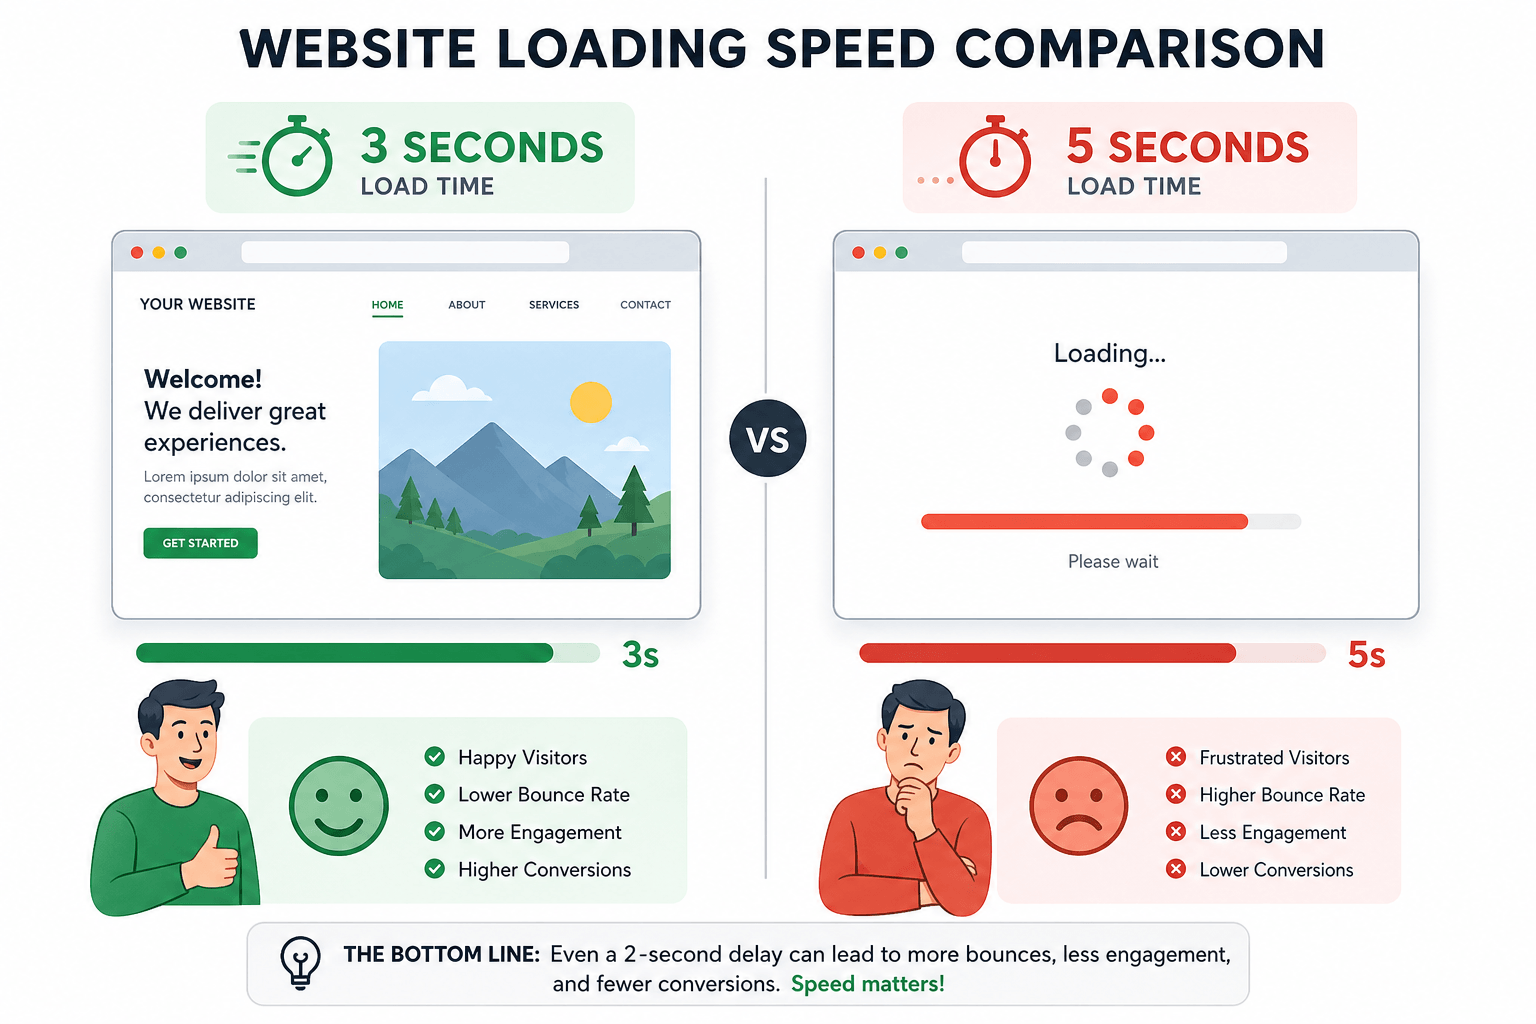
Website loading speed is not optional. A one-second delay reduces conversions by 7%. On mobile, that same delay drops conversion rates by 20%. For an online store making $100,000 daily, one second of slowness costs $7,000 in lost sales daily.
Users have spoken: 47% expect pages to load in 2 seconds or less. 40% abandon sites that take more than 3 seconds. Bounce rate increases dramatically after 3 seconds.
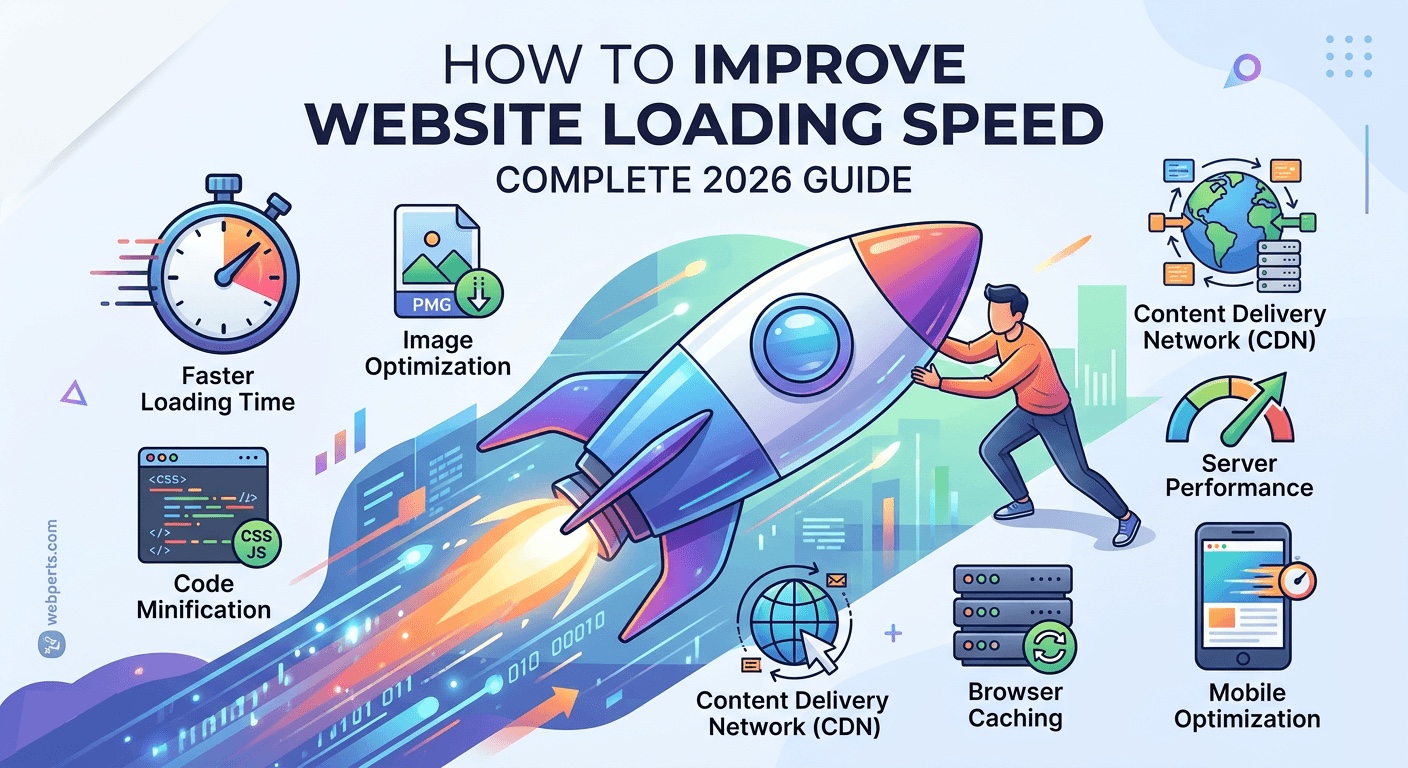
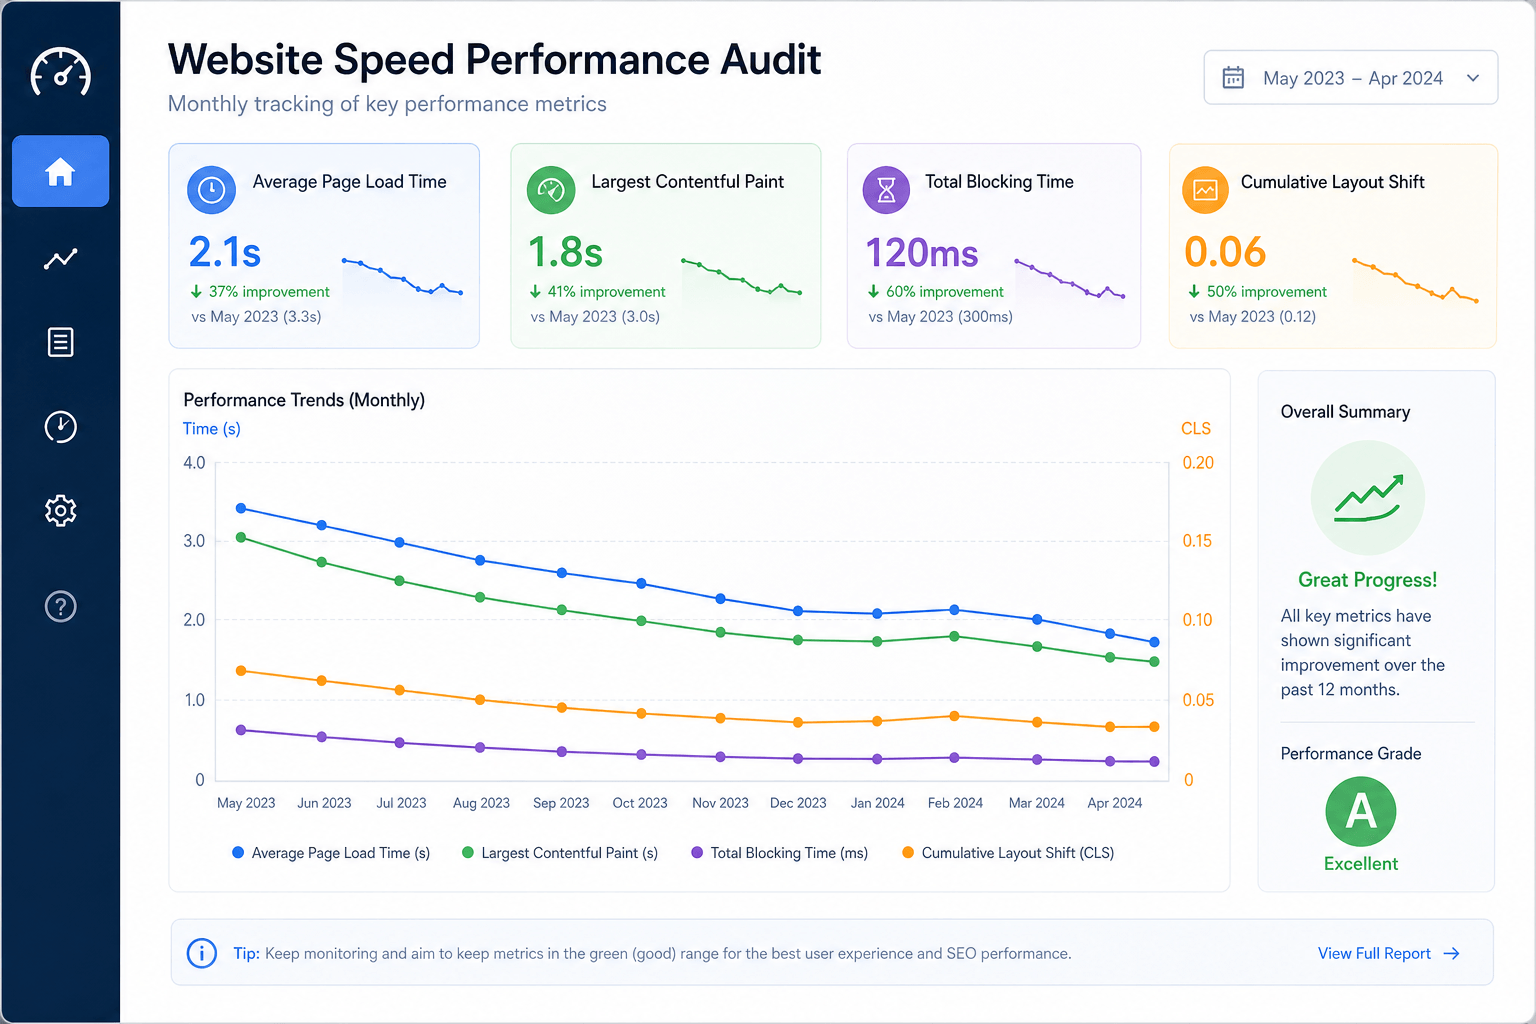
The good news? You can fix this. This guide walks through exactly what causes slow websites and how to solve each problem. No jargon. No fluff. Just clear, actionable steps that work.
What Is Website Loading Speed?
Website loading speed measures how quickly content appears when visitors arrive. But it's more complex than a single number.
Loading Time refers to how long all content takes to fully display. Responsiveness measures how quickly the page reacts to clicks, taps, or scrolls. A page can look fully loaded but feel sluggish if buttons don't respond instantly.
Time to Interactive (TTI) tracks when the page becomes fully usable for tasks like clicking links or filling forms. The target is under 3.5 seconds.
Visual Stability matters as much as speed. Have you ever tried clicking a button only to have the page jump and make you click something else? That's poor visual stability, and it frustrates users.
First Contentful Paint (FCP) should happen under 1.8 seconds. That's when the user first sees meaningful content on screen.
Why Website Speed Matters for Business
This isn't just a technical issue. Speed directly impacts revenue.
- One second delay = 7% fewer conversions on desktop
- One second delay = 20% conversion drop on mobile
- 53% of mobile visitors leave if pages take longer than 3 seconds
- 47% of consumers expect pages to load in 2 seconds or less
Slower sites lose visitors. They lose Google ranking position. They lose sales. Fast sites keep users happy and strengthen SEO performance.
Core Web Vitals: Google's Performance Standards
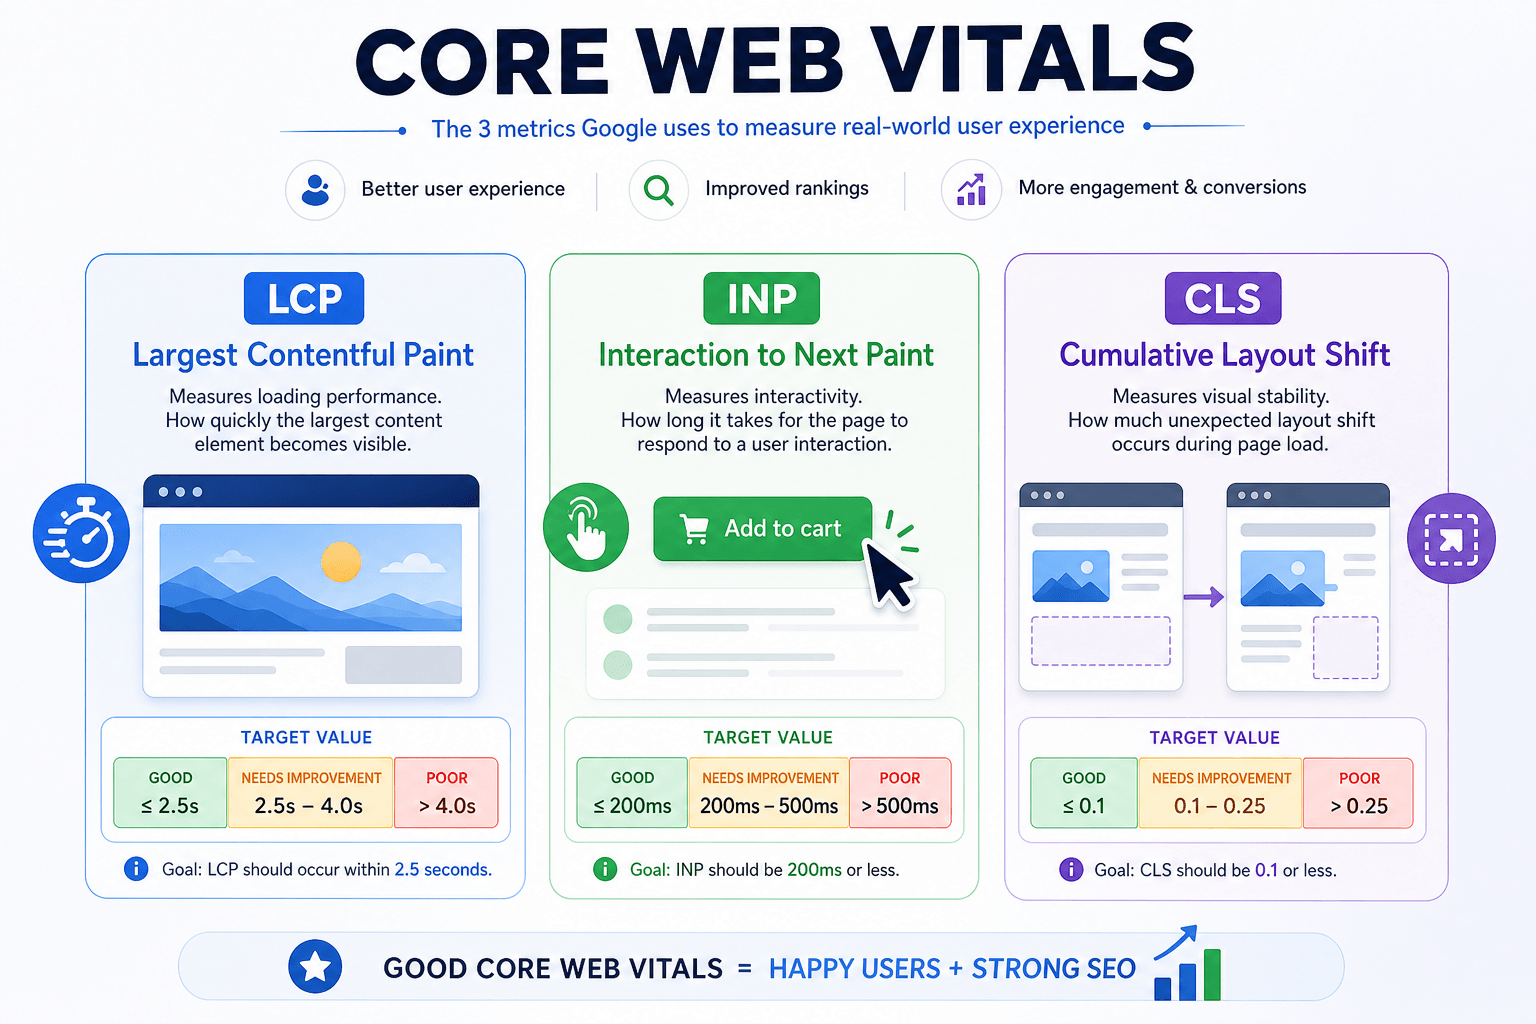
Google uses three specific metrics to measure user experience. These are called Core Web Vitals, and they directly affect your search rankings.
Largest Contentful Paint (LCP)
What it measures: How fast the main content loads
Target: Under 2.5 seconds
When does the biggest element on your page appear? Usually a hero image, video background, or large text block. If this is slow, users stare at a blank page.
Interaction to Next Paint (INP)
What it measures: How quickly your site responds to clicks/taps
Target: Under 200 milliseconds
High delays mean frustrating lag when users interact with your site. This is critical for buttons, forms, and menus.
Cumulative Layout Shift (CLS)
What it measures: Visual stability while loading
Target: Below 0.1
Poor layout stability means unexpected movement during loading. This frustrates users and hurts trust.
How to Test Website Speed
Before fixing anything, you need to know what's broken.
Google PageSpeed Insights (Start Here)
This is the most important tool to use. It's free and comes directly from Google. Simply enter your website URL and click analyze.
You get:
- Performance Score from 0 to 100 (target: 90-100)
- Specific optimization recommendations
- Separate Mobile and Desktop ratings
- Real user metrics from actual Chrome users
- Your Core Web Vitals status
Other Essential Testing Tools
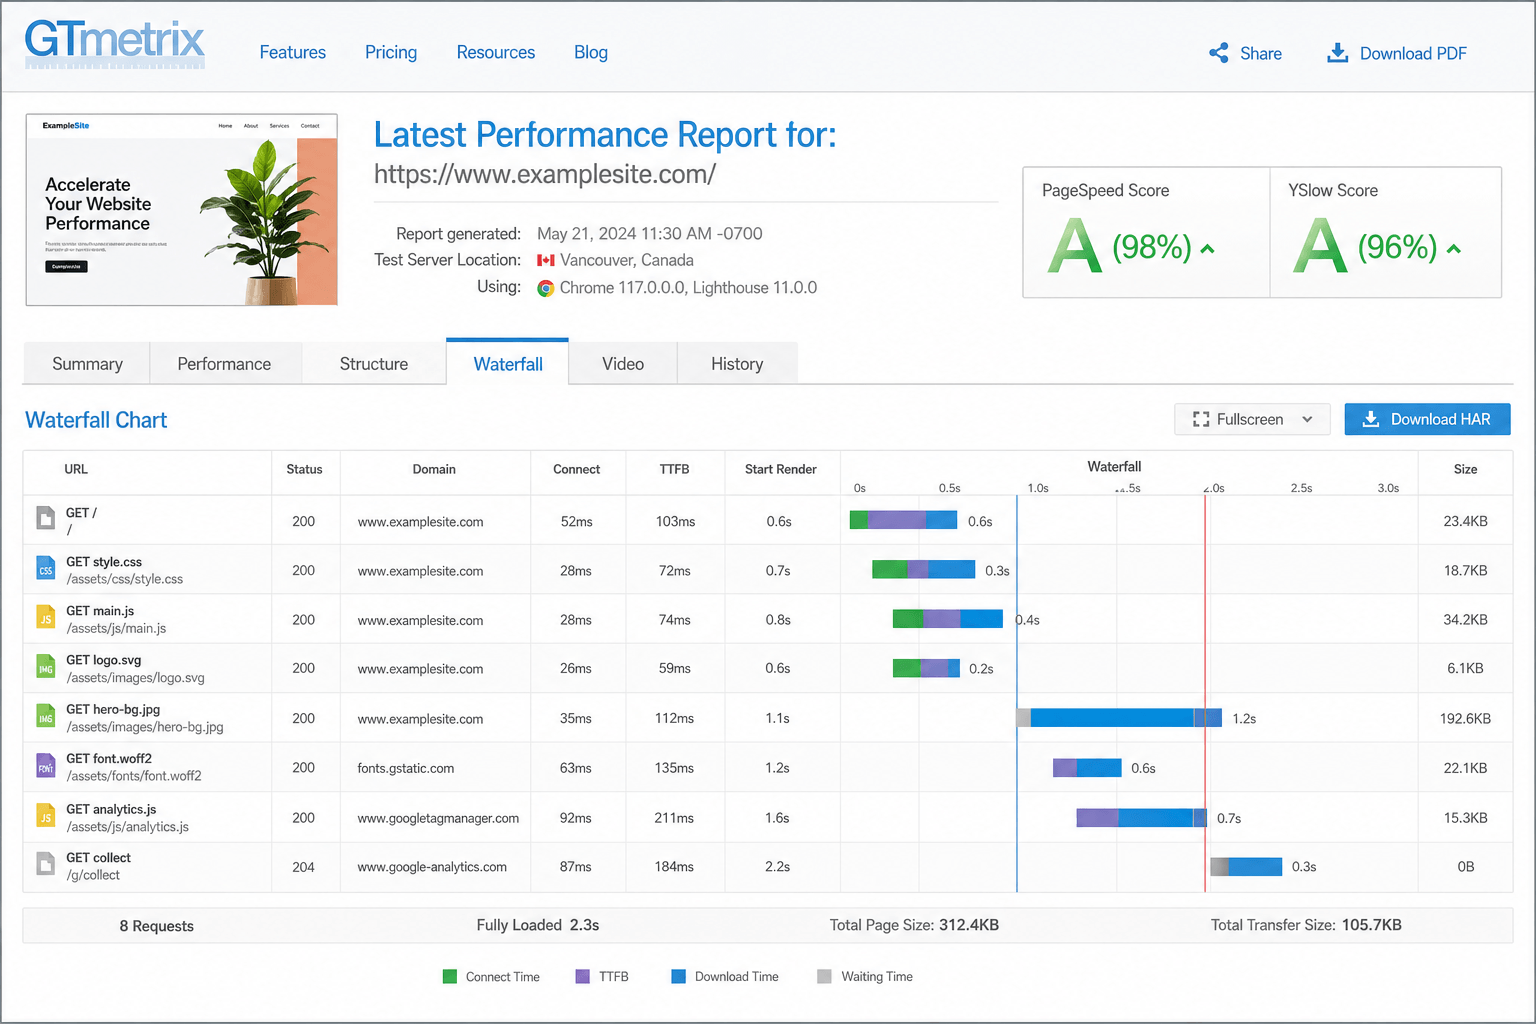
GTmetrix provides detailed waterfall timing charts showing exactly which files take the longest to load. You can see every image, script, and stylesheet with individual load duration. Target: A grade.
Lighthouse runs inside Chrome Developer Tools and gives detailed performance audits. Target: 90+ score. Run regularly to track improvements.
WebPageTest offers advanced features like testing on real mobile devices and different connection speeds. Excellent for diagnosing mobile-specific issues.
Pingdom tests your site from different geographic locations, helping you understand if speed problems are location-specific or global.
Common Reasons Websites Load Slowly
Most slow websites share the same problems. Here are the usual suspects:
1. Large, Unoptimized Images
Unoptimized images are the number one cause of slow websites. A single large photo can be several megabytes. Multiple photos add up fast. One page might end up downloading 20-30 megabytes just for images.
Maximum recommended image size: Under 200KB per image
2. Poor Hosting Quality
Shared hosting packages are cheap for a reason. You share server resources with many other websites. When one site gets a traffic spike, everyone slows down.
Target: 99.9% uptime and consistent response time under 200ms.
3. Excessive Plugins and Scripts
Every WordPress plugin adds code that must load. Plugin efficiency varies dramatically. Some are well-coded with lightweight functionality. Others are bloated and slow.
4. Unoptimized Code
Original code often contains unnecessary characters like spaces, line breaks, and comments. Browsers download every character, so extra bulk means extra time.
5. Too Many HTTP Requests
Each file on your page requires a separate HTTP request. Images, stylesheets, scripts, fonts, and icons all count. More requests mean more back-and-forth between browser and server.
Target: Under 50 HTTP requests
6. Render Blocking Resources
CSS and JavaScript files normally block page rendering. The browser stops displaying content until these files finish downloading, creating a blank screen while users wait.
Optimize Your Hosting
Your hosting provider sets the foundation for speed. Even perfectly optimized code runs slowly on bad hosting.
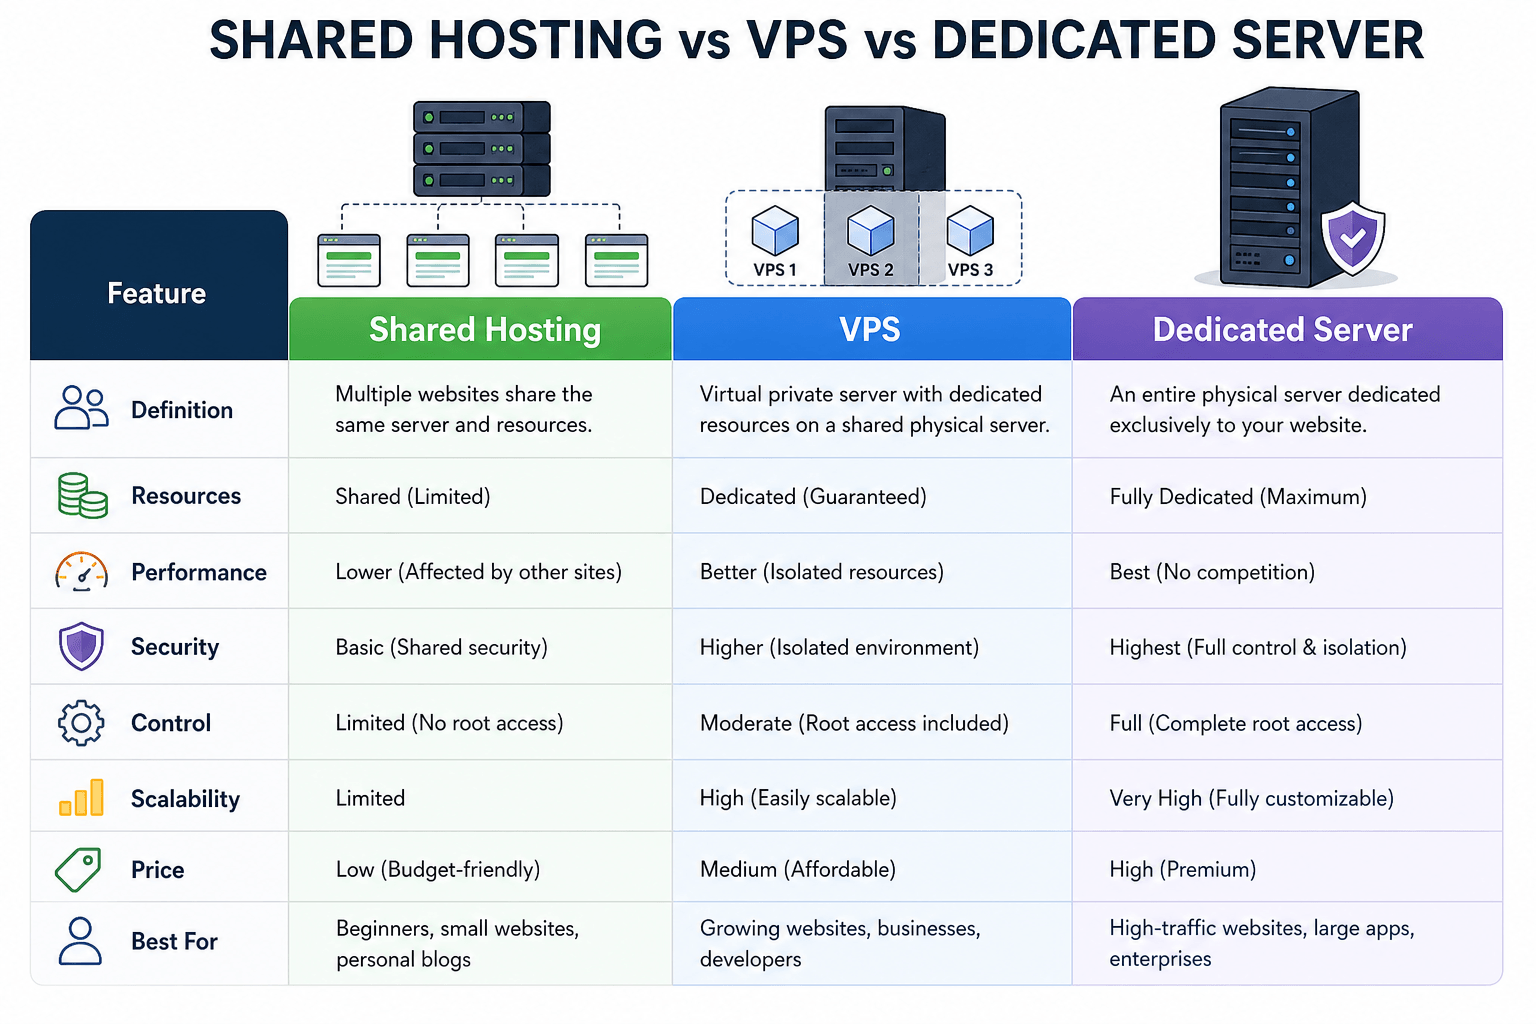
Shared Hosting vs VPS vs Dedicated Server
Shared Hosting: Your site shares CPU, memory, and bandwidth with many others. Performance is inconsistent and often slow. Good for: Very small sites with low traffic.
VPS Hosting: Virtual private server gives you dedicated resources within a shared physical server. More reliable and scalable. Good for: Growing businesses.
Dedicated Server: An entire physical server for your site alone. Maximum processing power and fastest performance. Good for: Large, high-traffic sites.
Cloud Hosting: Scalable across many servers with automatic failover. If one server fails, another takes over. Target: 99.9% uptime. Good for: Any serious business.
Server Performance Checklist
- SSD storage instead of old HDD drives for better data retrieval
- Built-in server caching systems for faster response
- Free CDN integration for global distribution
- Server response time under 200ms (ideally under 100ms)
- 99.9% uptime guarantee
Web Server Software Matters
Apache: Widely compatible but can struggle under high load.
NGINX: Handles concurrent connections more efficiently than Apache.
LiteSpeed: Includes built-in caching and outperforms both Apache and NGINX in benchmarks.
If you can choose, NGINX or LiteSpeed generally deliver better performance.
Optimize Website Images (Quick Win)
Images are usually the heaviest files on your site. Fixing images alone often cuts page weight by 50% or more.
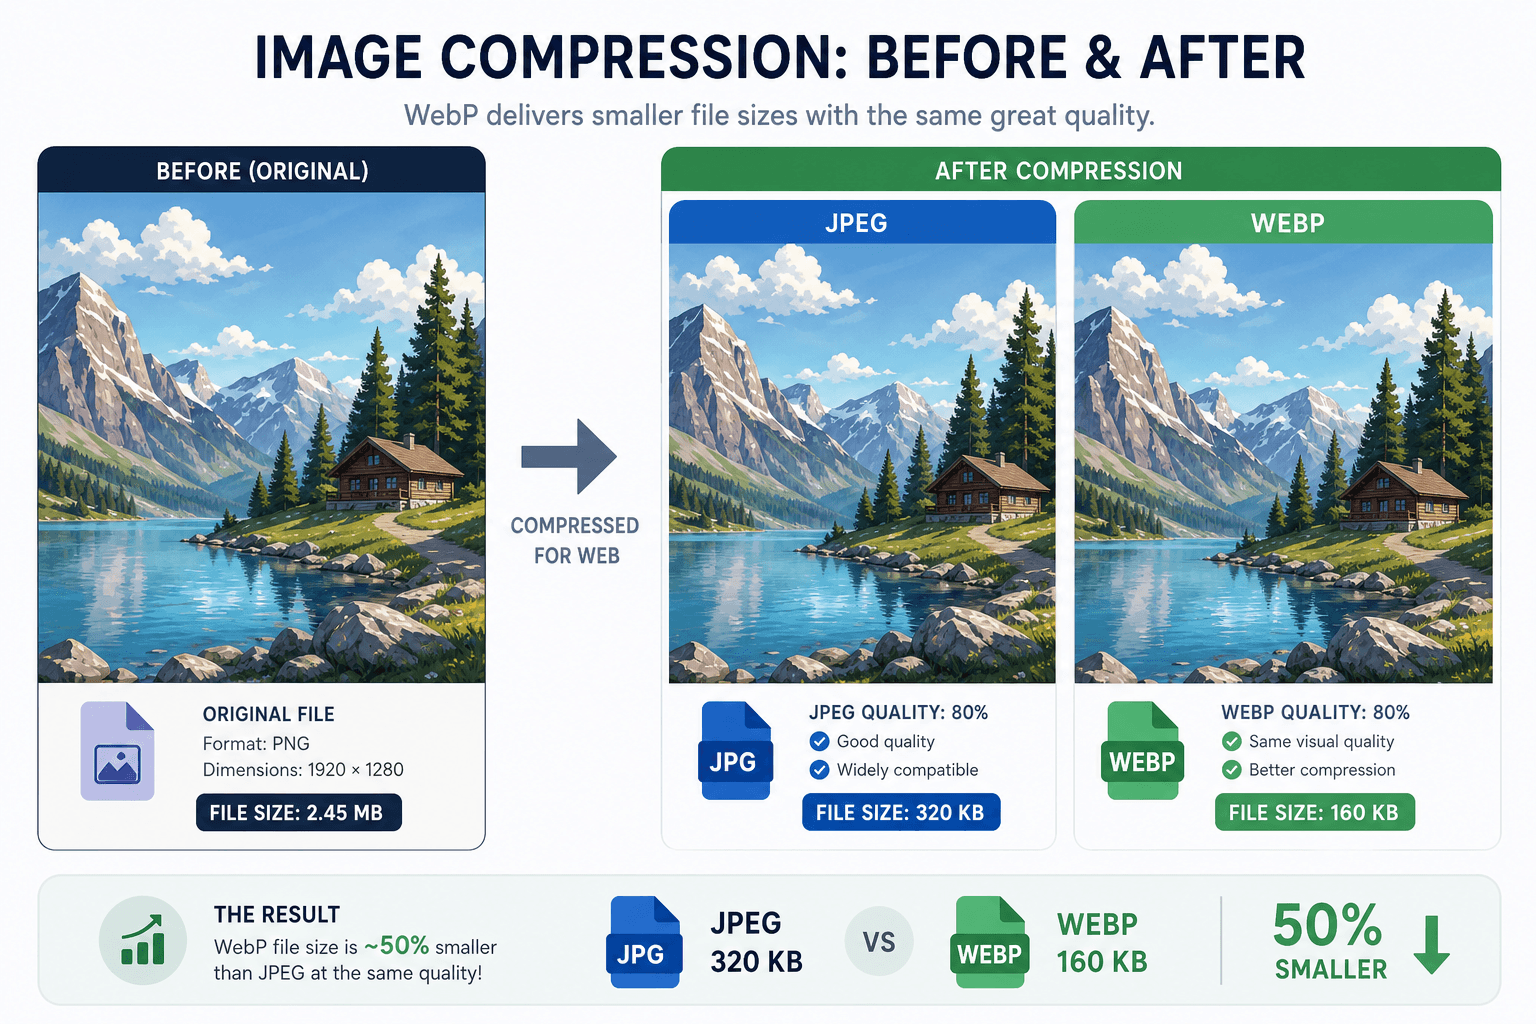
Image Compression Strategies
Image compression reduces file size while maintaining quality. Target compression reduction of 30-80%. Tools like TinyPNG, Squoosh, and Optimizilla make this easy.
Lossless compression removes unnecessary metadata without changing visual quality. Lossy compression slightly reduces quality for much smaller files. For most websites, high-quality lossy compression is barely noticeable but cuts file size by 70% or more.
Choose the Right Image Format
| Format | Best For | Characteristics |
|---|---|---|
| JPEG | Photos, complex images | Good quality, small size |
| PNG | Logos, graphics with transparency | Larger files, sharp edges |
| WebP | All images (modern browsers) | 25-35% smaller than JPEG |
| AVIF | All images (newer format) | 20-30% smaller than WebP |
| SVG | Icons, simple graphics | Infinitely scalable, tiny files |
Lazy Loading Images
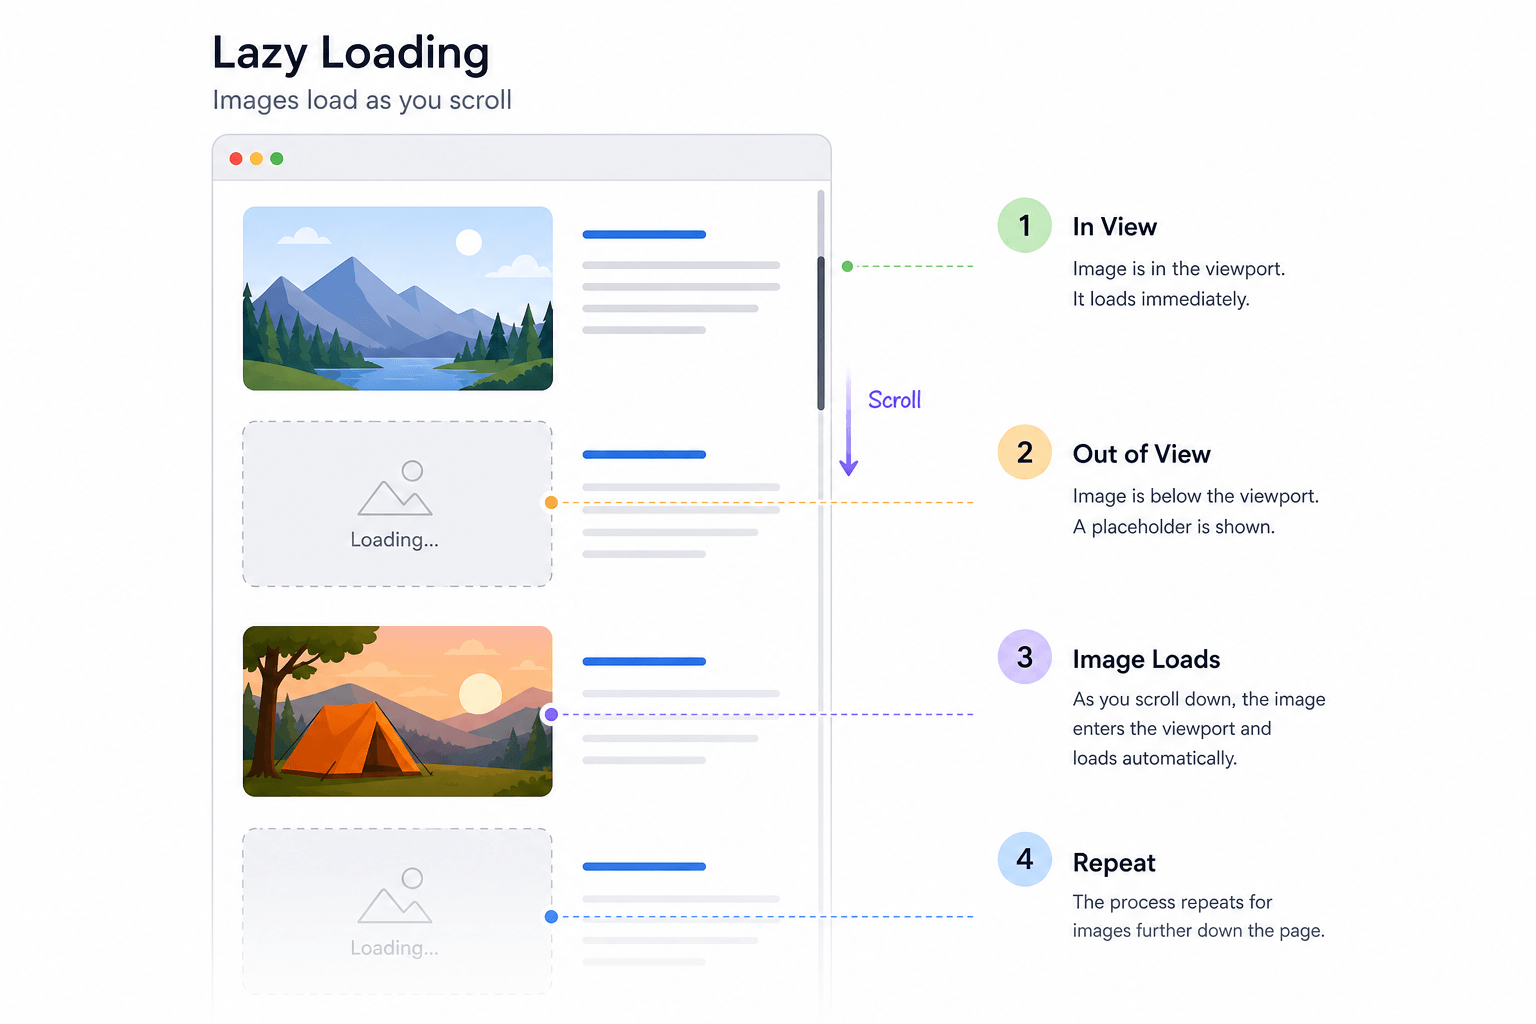
Lazy loading means images load only when they're about to appear on screen. Images far down the page don't load until the user scrolls near them.
Modern browsers support native lazy loading with a simple attribute:
<img src="image.jpg" loading="lazy" alt="description">
This alone cuts initial page weight dramatically. A long page with 50 images might only load the first 5 initially.
Important: Don't use lazy loading on your Largest Contentful Paint (LCP) element. If the main image uses lazy loading, it loads later than it should, making your LCP score worse.
Responsive Images for Mobile
Responsive images mean not serving desktop-sized images to mobile phones. A 2000 pixel wide image is unnecessary on a 375 pixel phone screen. That's five times more pixels than needed, and five times the file size.
Use the srcset attribute to provide different image sizes for different screen widths:
<img src="image.jpg" srcset="image-small.jpg 480w, image-large.jpg 1200w" alt="description">
Enable Browser Caching
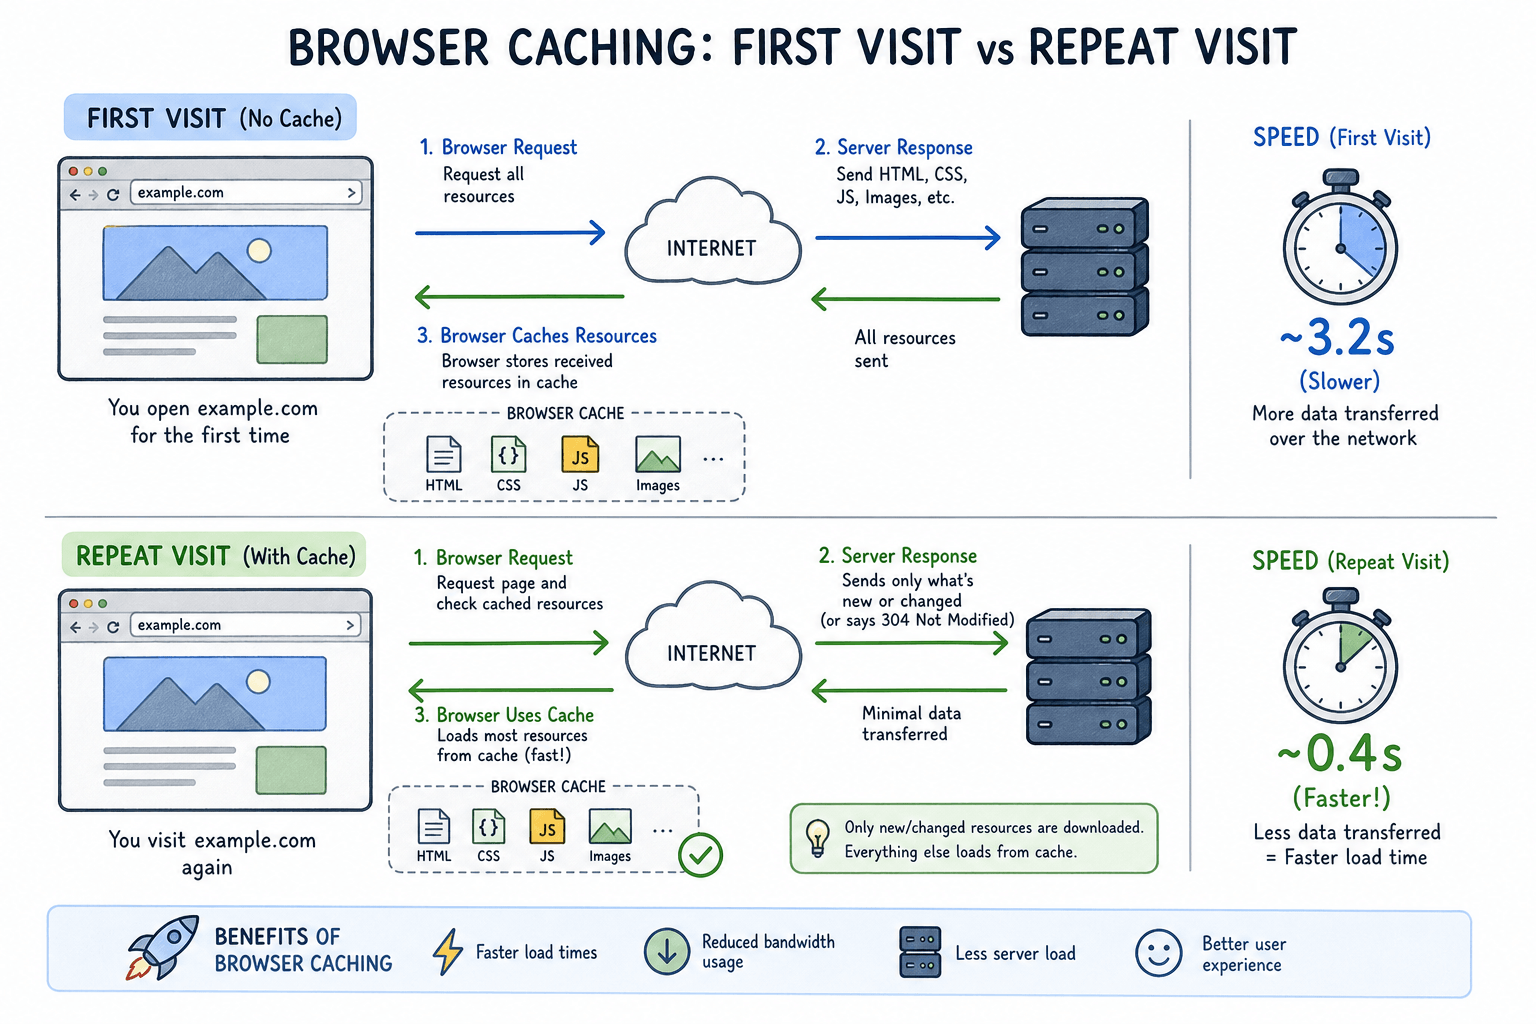
Browser caching stores website files on visitors' devices after the first visit. Repeat visits become much faster.
How Browser Caching Works
On the first visit, browsers download images, stylesheets, scripts, and other files. On the second visit, the browser loads most files from local cache instead of downloading them again. This eliminates many HTTP requests and dramatically speeds up return visits.
Repeat visit speed improvement is often 50-70% faster than first visits.
Cache Duration Recommendations
- Images: 1 year (rarely change)
- CSS and JavaScript: 1 week to 1 month
- HTML: A few hours to 1 day (changes more frequently)
Set Up Browser Caching
For Apache, add this to your .htaccess file:
AddOutputFilterByType DEFLATE text/html text/css text/javascript
For NGINX, add to your configuration:
gzip on;
gzip_types text/html text/css application/javascript;
Minify CSS, JavaScript, and HTML
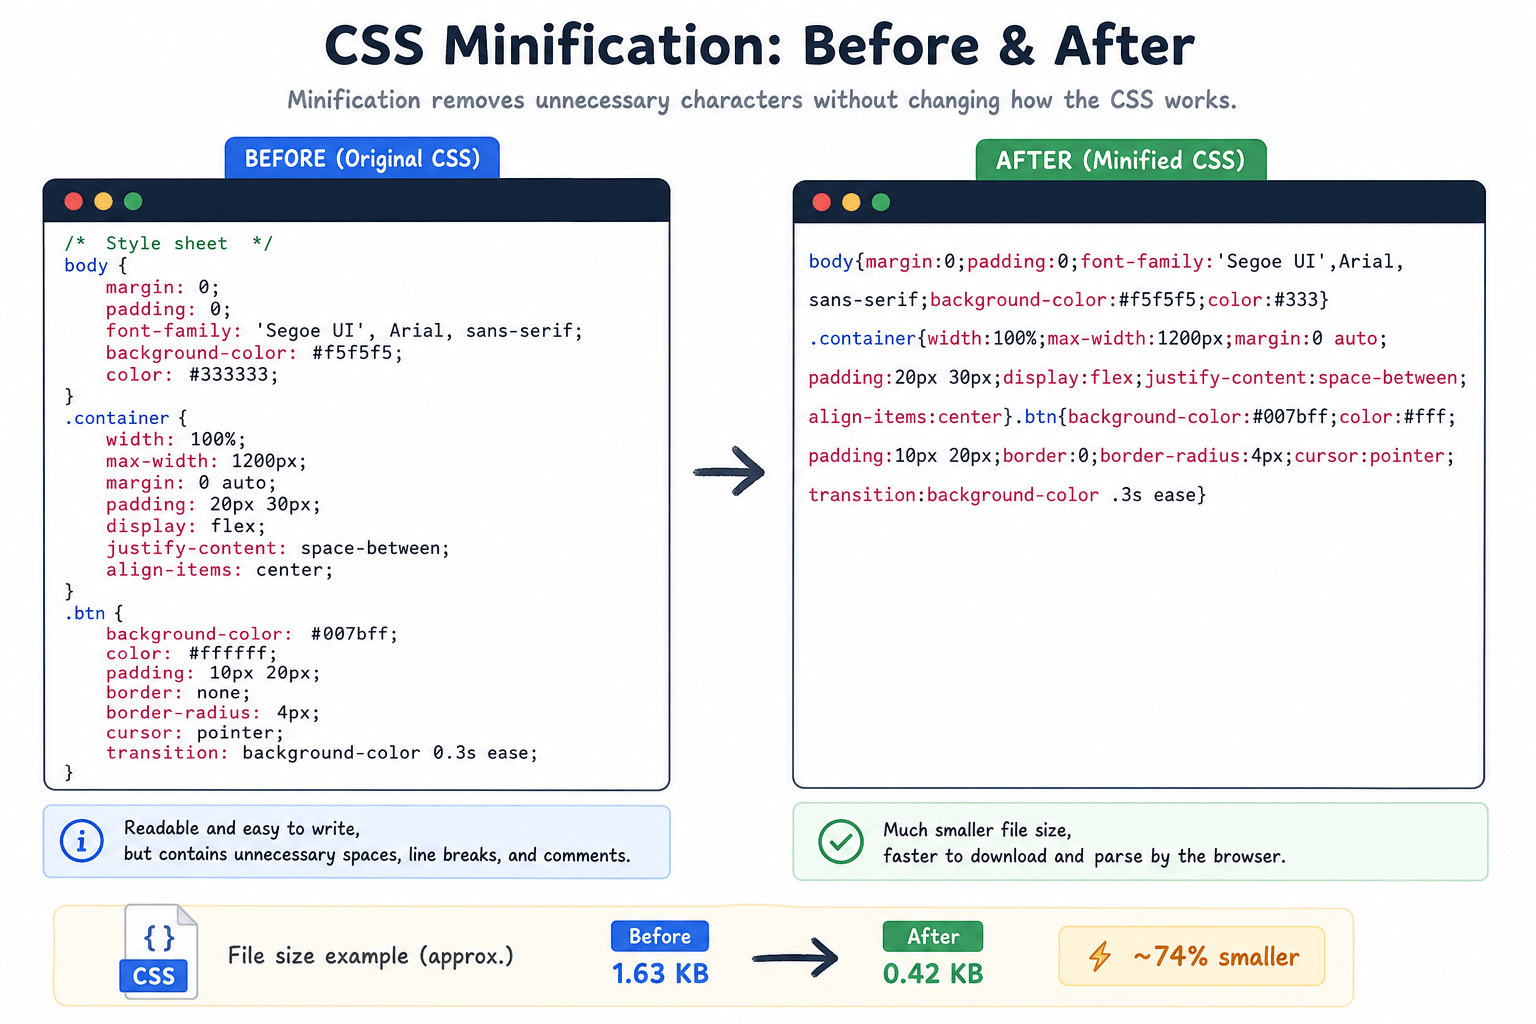
Minification removes unnecessary characters from code: spaces, line breaks, comments, and other formatting. File size shrinks significantly.
Original CSS might look like this:
/* This is the header style */
.header {
  background-color: blue;
  padding-top: 10px;
  padding-bottom: 10px;
}
Minified version:
.header{background-color:blue;padding:10px 0}
The minified version does the same thing with far fewer characters. On large files, the difference can be 30-50% smaller file sizes.
Remove Unused CSS and JavaScript
Many sites load CSS and JavaScript that's never used. A theme might load 200 kilobytes of CSS, but only 50 kilobytes are actually used on a given page.
Tools like PurgeCSS and UnCSS remove unused code. Coverage reports in Chrome Developer Tools show exactly which CSS and JavaScript lines are never executed. Removing unused code can cut file sizes by 50% or more.
Enable GZIP or Brotli Compression
Compression shrinks files before they leave your server. The browser decompresses them automatically.
Compression Performance
GZIP Compression: Standard algorithm available on most servers. Text files compress extremely well:
- HTML often compresses by 70-80%
- CSS compresses by 60-70%
- JavaScript compresses by 60-70%
Brotli Compression: Newer algorithm with 20% better compression efficiency than GZIP. Preferred when available on your server.
Server Setup
For Apache, enable mod_deflate. For NGINX, add to your configuration:
gzip on;
gzip_types text/html text/css application/javascript;
gzip_comp_level 6;
For Brotli on NGINX, install the brotli module and add:
brotli on;
brotli_types text/html text/css application/javascript;
Reduce HTTP Requests
Each file on your page requires a separate HTTP request. The target is under 50 requests. Fewer requests mean faster loading.
Combine Assets
Combine multiple CSS files into one. Combine JavaScript files into one or two files. This reduces request overhead.
CSS Sprites: Combine multiple small images into a single image file. Then use CSS background positioning to show only the relevant portion. This turns ten HTTP requests into one.
Modern HTTP Protocols: HTTP/2 and HTTP/3
HTTP/2: Allows multiple requests to be sent simultaneously over a single connection. Connection efficiency improves dramatically.
HTTP/3: Even faster, using UDP instead of TCP to reduce latency.
With HTTP/2, combining files is less critical than with HTTP/1.1. Most modern servers support HTTP/2 and HTTP/3 out of the box. Ensure your server has them enabled.
Remove Unnecessary Third-Party Scripts
Audit every script on your site. Analytics, ads, social media widgets, chat tools, and tracking pixels all add requests. Third-party scripts are particularly problematic because you don't control them. The script provider might have server issues, and your site suffers.
Ask yourself: Does this script provide clear value? If not, remove it. Load third-party scripts asynchronously when possible.
Use a Content Delivery Network (CDN)
A CDN distributes your site across a global network of servers called Edge Servers. When visitors arrive, they receive files from the server closest to them.
How CDN Works
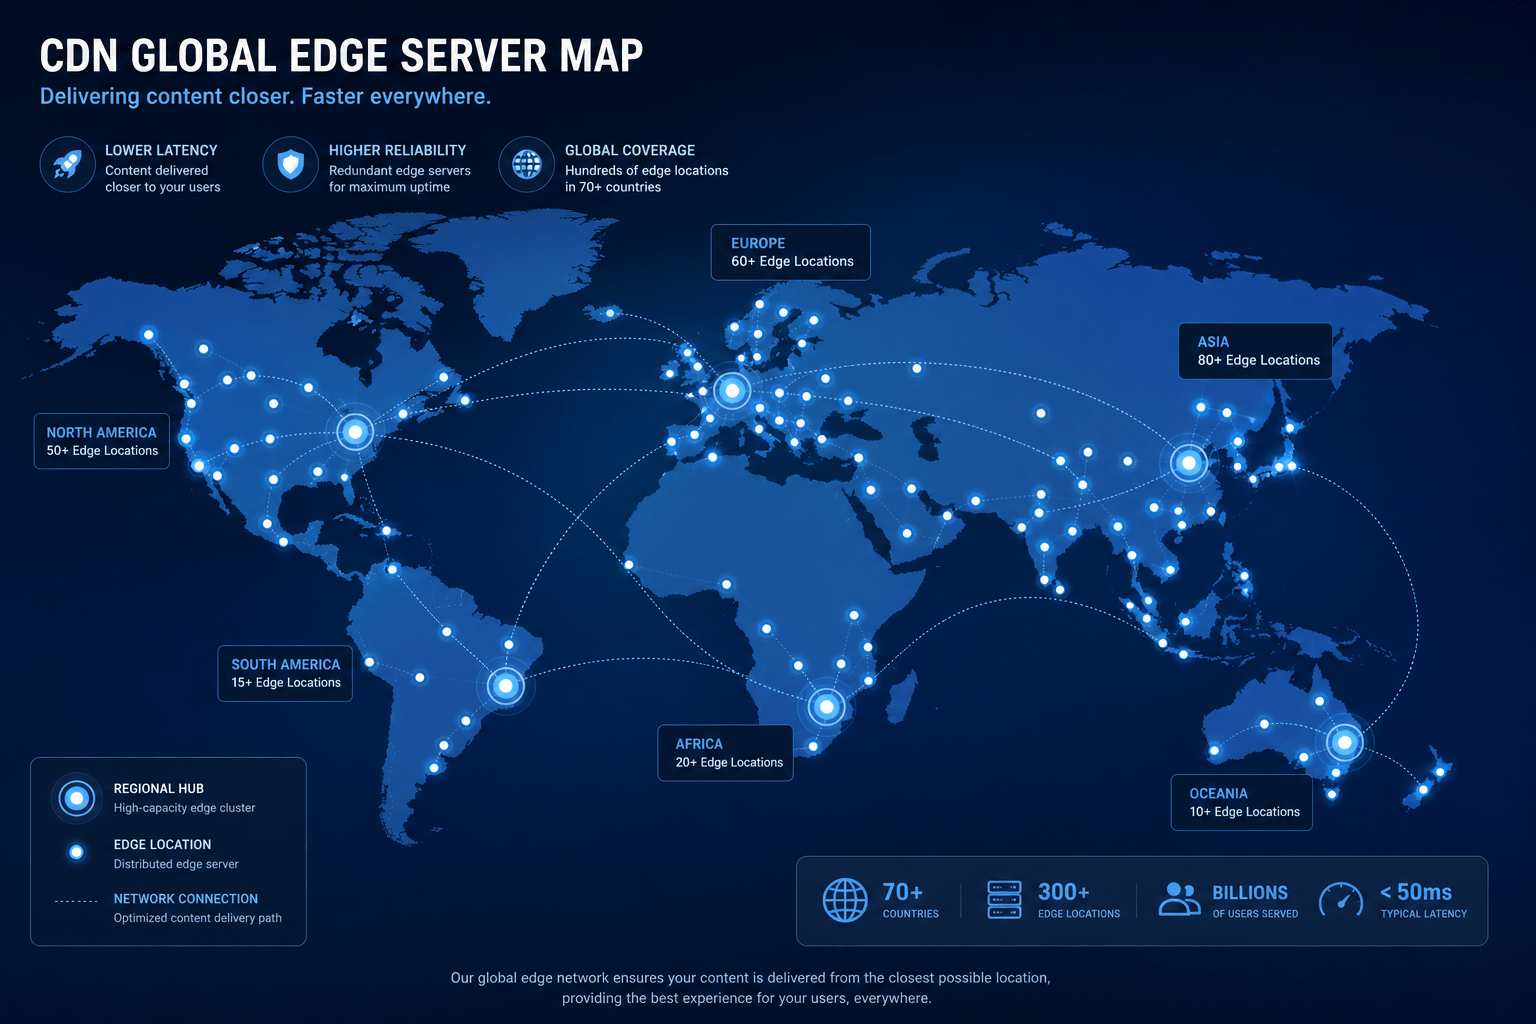
Without a CDN: Every visitor connects to your single origin server. A visitor from Japan waits for files from your US-based server. That's a long distance and adds significant delay.
With a CDN: Your static assets are copied to servers around the world. The Japanese visitor connects to a Tokyo server instead. The distance is much shorter, so files arrive much faster.
Geographic distribution dramatically reduces latency, especially for international visitors.
Popular CDN Providers
- Cloudflare: Free plan available, excellent for small-medium sites. Over 200 locations globally. Includes DDoS protection.
- BunnyCDN: Affordable with excellent performance. Simple pay-as-you-go model.
- Amazon CloudFront: Works well for AWS users. Excellent for large-scale operations.
- Akamai: Enterprise choice for massive sites. Top-tier reliability but higher cost.
Improve Core Web Vitals
Largest Contentful Paint (LCP) Optimization
To improve LCP (target under 2.5 seconds):
- Optimize hero images using compression and modern formats (WebP/AVIF)
- Remove render-blocking resources that delay content display
- Upgrade hosting to reduce server response time
- Use
fetchpriority="high"on important images to tell browsers they matter most - Defer non-critical CSS and JavaScript
Interaction to Next Paint (INP) Optimization
To improve INP (target under 200ms):
- Break up long JavaScript tasks into smaller chunks
- Remove unnecessary third-party scripts competing for processing time
- Use
asyncordeferfor non-critical scripts - Reduce JavaScript bundle size by removing unused code
Cumulative Layout Shift (CLS) Optimization
To improve CLS (target below 0.1):
- Always set width and height attributes on images and videos to reserve space
- Reserve space for ads and embeds so content doesn't pop in later
- Avoid inserting content above existing content unless triggered by user action
- Use CSS aspect ratio boxes for dynamic content containers
Optimize Website Code
Async vs Defer Attributes
The async and defer attributes control how JavaScript loads:
Async: Script loads in background and executes immediately. Use for independent scripts like analytics.
<script src="analytics.js" async></script>
Defer: Script loads in background but executes only after HTML is fully parsed. Use for scripts that depend on the DOM.
<script src="main.js" defer></script>
Both prevent render-blocking resources, allowing HTML to parse while scripts load.
Load Non-Critical Scripts After Page Load
Chat widgets, analytics, social media buttons, and many third-party scripts aren't needed for initial page display. Load these after the page has loaded:
window.addEventListener('load', function() {
  // Load non-critical scripts here
});
Clean Coding Practices
Write efficient code. Avoid deep nesting of elements. Keep DOM size under 1500 nodes total. Flatten CSS selectors. Reduce JavaScript loops. Every line of code your browser processes takes time.
Optimize Database Performance (WordPress)
Your database stores everything: posts, pages, comments, settings, and user data. Slow databases slow down your entire site.
Clean Unnecessary Data
Over time, databases collect junk. Post revisions pile up. Spam comments accumulate. Regular cleaning improves performance significantly.
Database Indexing
Database indexing is like a book index. It helps MySQL find specific information without scanning every row. Missing indexes cause slow queries.
Every WHERE, JOIN, and ORDER BY clause should have a supporting index.
Implement Object Caching
Object caching stores database query results in memory. Instead of running the same query repeatedly, Object Cache serves the result instantly.
Redis and Memcached are excellent options. For WordPress, plugins like "Redis Object Cache" make setup easy.
Reduce Plugin and Script Usage (WordPress)
Plugins add features but also add code. Plugin efficiency varies dramatically.
Identify Heavy Plugins
Some WordPress plugins load CSS and JavaScript on every page, even pages where they're not needed. Use Query Monitor for WordPress to identify heavy plugins and unnecessary scripts.
Remove Unused Plugins
Deactivating a plugin isn't enough. Remove unused plugins completely. They can still cause security issues if not updated.
Replace Slow Plugins
Sometimes a necessary plugin is poorly coded. Look for lighter alternatives that do the same job more efficiently.
Use a Script Manager
Plugins like Asset CleanUp let you control which scripts load on which pages. Prevent contact form plugins from loading on pages without forms. This dramatically improves backend performance.
Optimize for Mobile
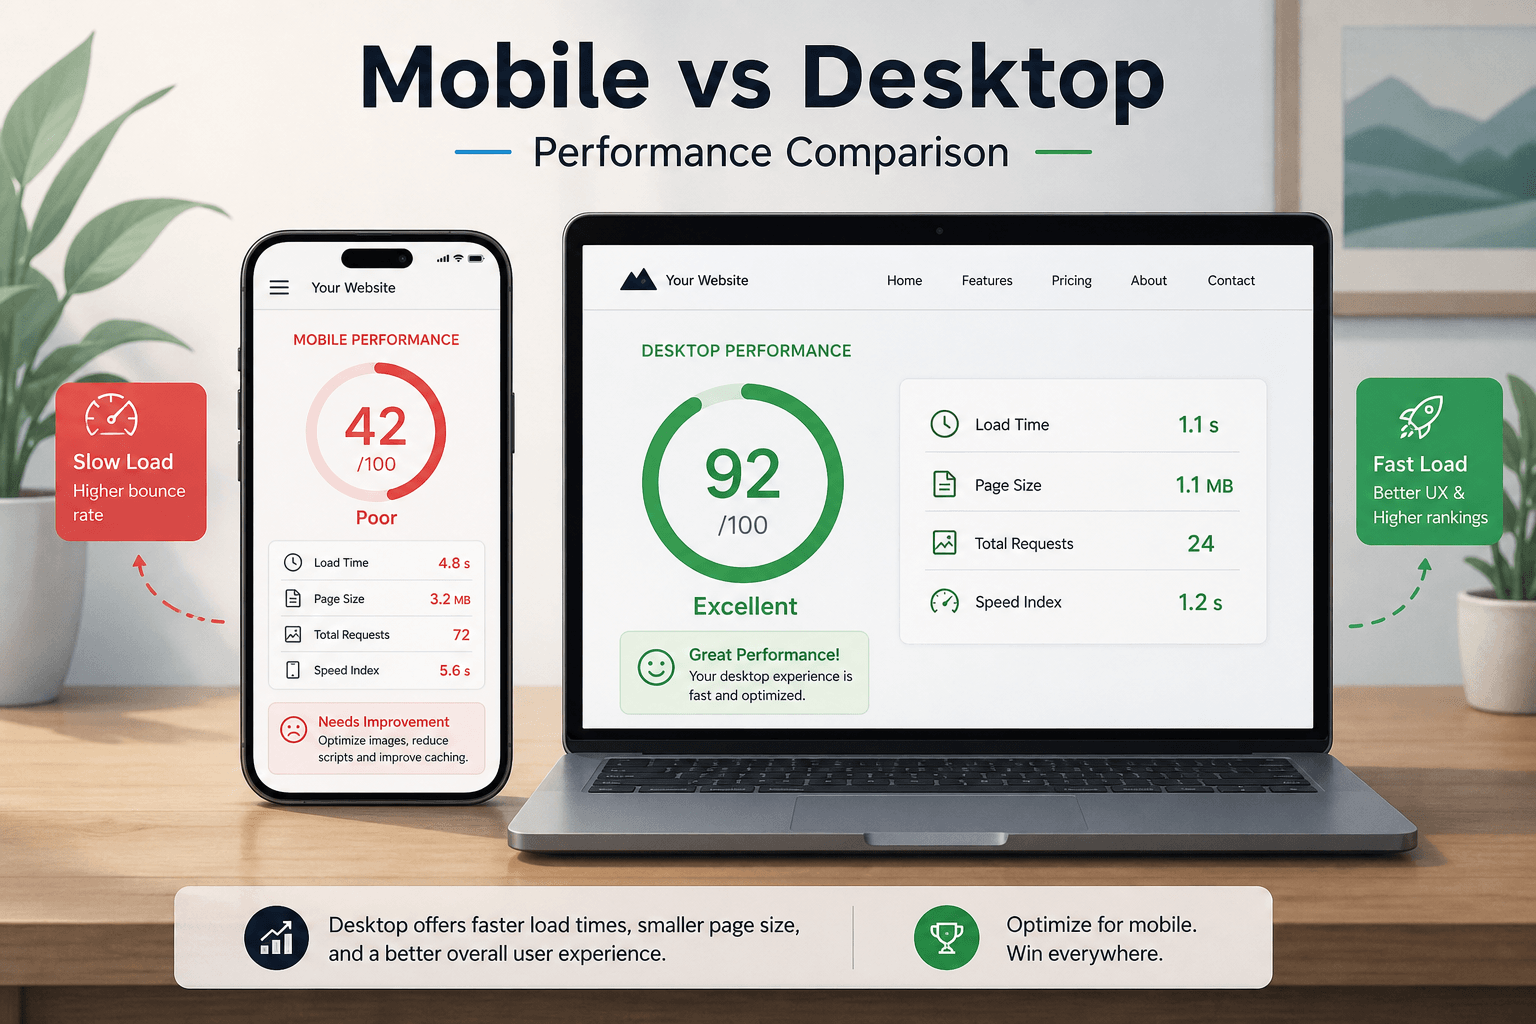
Most traffic comes from phones with slower processors, less memory, and slower connections. True mobile optimization is critical.
Mobile Responsiveness
Your site must work well on any screen size. But responsive design alone doesn't guarantee speed. True mobile optimization serves different assets to mobile devices.
Reduce Mobile Resource Usage
- Reduce JavaScript on mobile
- Simplify CSS selectors
- Use adaptive images serving smaller files to smaller screens
- Remove decorative elements that add no value on mobile
Touch Accessibility
Mobile users tap, not click. Buttons need to be at least 44x44 pixels. Links need enough spacing to prevent accidental taps. This improves both usability and performance perception.
Web Fonts and Performance
Web fonts add HTTP requests. Each font-loading request for a different weight or style adds another round-trip.
Optimize Font Loading
- Use system fonts when acceptable
- Limit font families and weights
- Each font file should be under 100 kilobytes
- Use
font-display: swapto prevent invisible text during loading
Icon Fonts: Consider SVG icons instead. They can be inline in your HTML and add no extra HTTP requests.
Server Response Time (TTFB)
Server Response Time, or Time to First Byte (TTFB), measures how long your server takes to start sending data. Aim for under 800ms (ideally under 200ms).
Improve Backend Processing
Profile your backend code to find slow functions. Look for:
- Loops that run too many times
- API requests waiting for external services
- Large file processing operations
- Inefficient data transformations
Use DNS Optimization
DNS lookup converts your domain name into an IP address. Slow DNS adds 50-200 milliseconds before your server even receives the request.
Use fast DNS providers like Cloudflare DNS, Google Public DNS, or Amazon Route 53.
Implement Server-Side Caching
Page Cache: Stores complete HTML pages. When a request arrives, the server delivers the cached page immediately instead of generating it from scratch.
Object Cache: Stores database query results, so repeated queries get results from cache instead of hitting the database.
Continuous Monitoring and Maintenance
Speed work is never truly finished. Websites change. Content gets added. WordPress plugins update. Performance drifts over time.
Regular Performance Audits
Schedule audits every month. Use Google PageSpeed Insights and check Core Web Vitals in Google Search Console. Early detection prevents problems from frustrating visitors and hurting rankings.
Track Performance Over Time
Use tools like DebugBear or SpeedCurve for performance benchmarking. These tools show exactly when performance changed and what changed alongside it.
Update Themes and Plugins Regularly
Outdated themes and plugins are slow and insecure. Test updates on a staging site first before applying to your live site. Sometimes updates improve security but affect performance.
Maintain Lightweight Design
The fastest code is code that doesn't exist. Before adding something new, ask: Is this necessary? Does it provide real value? A simple, fast website beats a bloated, slow website every time.
Common Website Speed Myths
Myth: "My Site Is Fast Enough"
Check your analytics and Core Web Vitals. Many site owners think their site is fast until they test it. Run Google PageSpeed Insights right now.
Myth: "Better Hosting Fixes Everything"
Better hosting helps, but it doesn't fix unoptimized images, render-blocking resources, or excessive requests. You need to address all factors.
Myth: "I Only Need to Optimize Once"
Websites change constantly. Performance requires ongoing attention. Schedule monthly audits and act on issues quickly.
Website Speed Statistics to Remember
| Metric | Target / Impact |
|---|---|
| Ideal page load time | 1 to 3 seconds |
| Acceptable load time | Under 5 seconds |
| 1 second delay impact | 7% fewer conversions |
| 1 second delay (mobile) | 20% conversion drop |
| Bounce rate above 3 seconds | Increases dramatically |
| Target total page size | Under 2MB |
| Target HTTP requests | Under 50 |
| Time to Interactive (TTI) | Under 3.5 seconds |
| First Contentful Paint (FCP) | Under 1.8 seconds |
Every improvement you make matters. Shaving half a second off load time directly impacts engagement and sales.
Final Thoughts
Website Loading Speed is not a technical nicety. It is a business necessity. Performance Efficiency across your entire site determines user happiness. Slow sites lose visitors, lose Google Search Ranking position, and lose sales. Fast sites keep users happy and Search Engine Optimization (SEO) performance strong.
Start with a speed test. Identify your biggest problem, usually images or hosting. Fix that first. Then move to the next issue. Small improvements add up. An Optimization Checklist helps you track progress and ensure nothing gets missed.
And here is something important to know. You do not have to figure this all out alone.
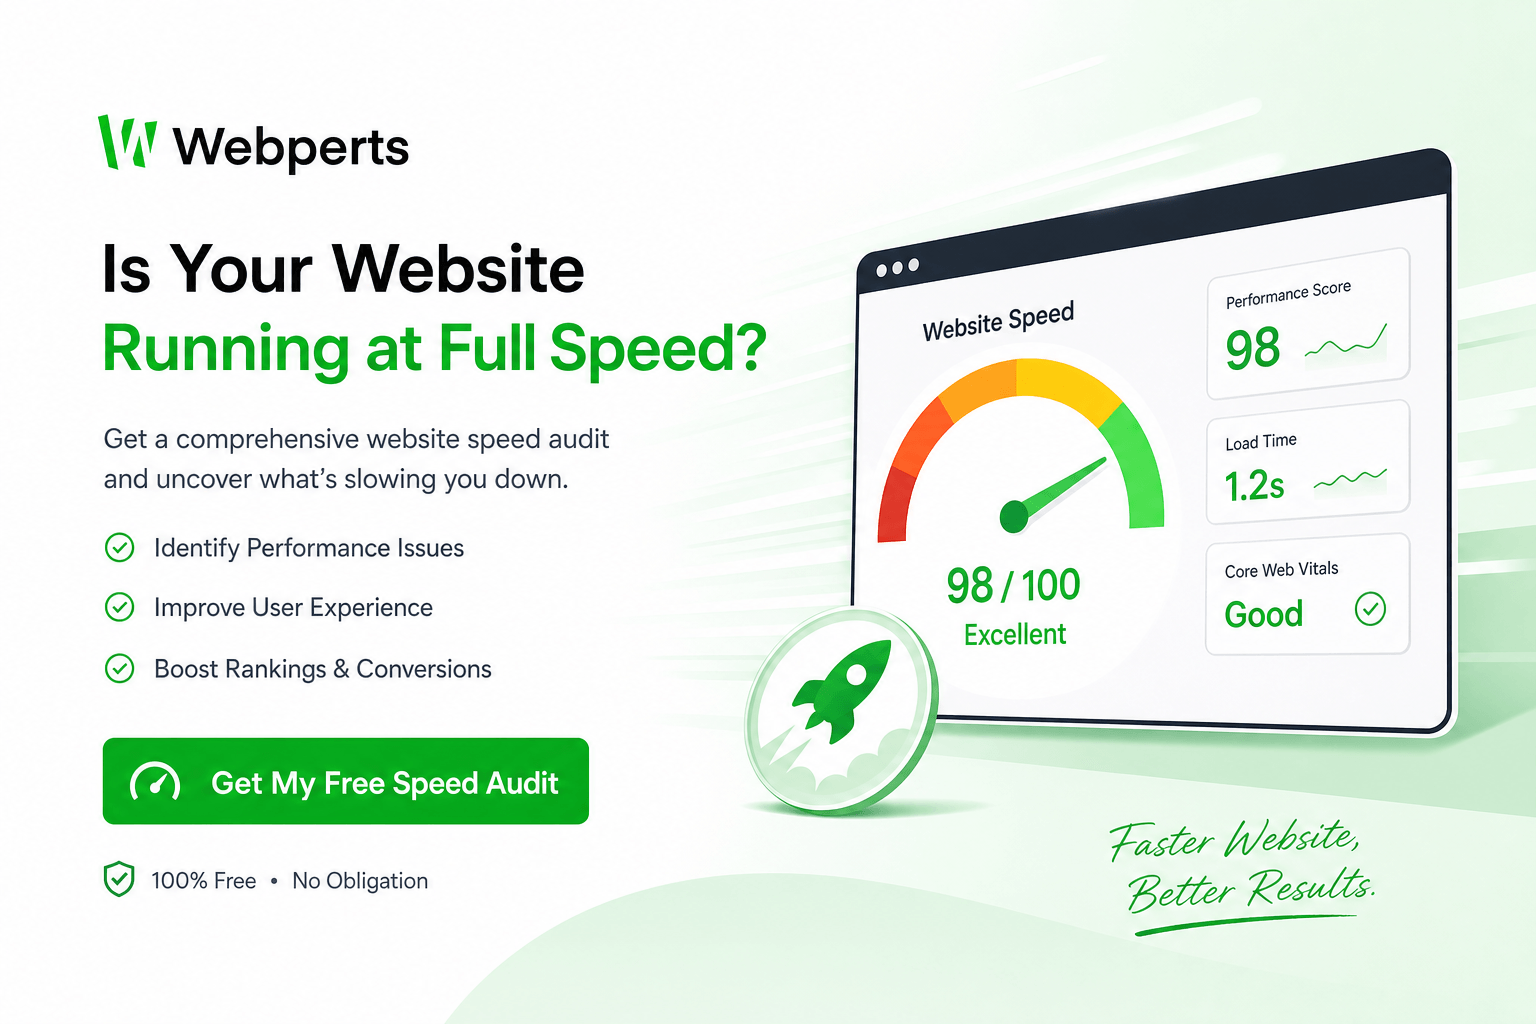
The Webperts team, a leading web development company in Dubai, specializes in Website Performance optimization. They have seen every possible performance problem and know exactly how to fix them. Their methods are proven. Their strategies deliver real results for E-commerce Websites, Blog Websites, SaaS Platforms, and Media Websites alike.
If you want a comprehensive Performance Audit of your website, visit Webperts and submit your site. The Webperts team will analyze your Technical SEO, Core Web Vitals, and every other speed factor. They will provide a clear Optimization Checklist for improvement. No guesswork. Just solutions that work.
Your visitors are waiting. Make sure your site loads fast enough to keep them there.