Running a website audit is just the starting line — tracking your audit progress over time is where the real value comes from. An audit is a single snapshot of your website health. Progress tracking turns that snapshot into a full photo album that shows your improvement journey across weeks and months.
To track audit progress properly you need three things: a clear baseline, a focused set of key metrics (KPIs), and a consistent tracking system with regular review cycles. Without these, you are guessing. With them, you make data-driven decisions and prove ROI.
If you have ever run a website audit, you know the feeling. You get that audit report full of findings, warnings, and recommendations, and it can feel overwhelming at first. But here is the thing — running the audit is just the beginning. The real work begins when you start making improvements, and the only way to know if your fixes are working is to track your audit progress over time.
Think of it like a physical checkup. The doctor runs tests and gives you a report, but the report itself does not make you healthier. You need to follow the recommendations, change your habits, and get retested later to see if your health improved. Website audits work exactly the same way. Once your initial audit is completed, you have a starting point. From there, you mark items as Baseline Established and begin the improvement journey.
In this guide, I will walk you through exactly how to track your audit progress — what metrics matter, how to set up a tracking system, and how to know if your optimization efforts are actually paying off. Let us get started.
1
What Website Audit Progress Tracking Means
Audit progress tracking is the ongoing process of monitoring how your website health improves after you implement changes based on an initial website audit. It is not a one-time event. It is a continuous cycle of measuring, fixing, and measuring again within a clear audit framework.
An audit itself is a snapshot. It captures your website health at a specific moment with a particular audit type (technical, content, UX, or security) and a defined scope. The audit date becomes your starting point. Progress tracking turns that single snapshot into a timeline that shows where things stand at every stage — items marked Audit In Progress, Partially Implemented, Fully Implemented, Under Verification, or Completed Successfully.
Conducting an Audit
You crawl your site, identify issues, and generate a report. This is the discovery phase — it tells you what to fix and establishes your baseline.
Tracking Improvements
You run follow-up audits and compare them to previous ones. This is the measurement phase — it tells you whether your fixes actually worked.
Continuous Monitoring
Websites are never static. New content, plugins, and design changes can break old fixes. Monitoring catches regressions early, before they hurt traffic.
Search engines love websites that get better over time. When you track your audit progress, you can see exactly which SEO improvements are moving the needle. Maybe fixing broken links helped crawlers navigate your site more efficiently. Maybe speeding up your product pages reduced your bounce rate. Without tracking you are just guessing. With tracking, you make data-driven decisions using real key performance indicators (KPIs).
2
Why Tracking Audit Progress Matters
You might be wondering if all this tracking is really necessary. The short answer is yes. Here is why it matters so much.
Measuring Real Impact
Say your audit recommended compressing images on 50 pages. Did it actually help? Tracking page speed before and after tells you. You might see Largest Contentful Paint (LCP) drop from 4.2s to 2.1s — an improvement you can measure and celebrate.
Identifying Unresolved Issues
Some issues are stubborn. You fix them and they come back. Tracking with an issue log helps you spot recurring problems — and recurring problems mean something deeper is wrong at the root, not just the symptom.
Preventing Regressions
A developer might remove a canonical tag during an update. A server change might break your redirects. Tracking catches these regressed issues quickly with alerts — problems you already fixed that have quietly returned.
Demonstrating ROI
If you are spending money on SEO, you need to prove it works. Trend data lets you show stakeholders the return on investment in plain numbers they understand and trust.
Here is what demonstrating ROI looks like in practice. With clean trend data, you can confidently tell a stakeholder or client:
These numbers tell a story. They show that your investment is paying off, with clear benchmark achievement against your target score. Websites that track their audit progress consistently outperform those that do not — because they catch problems early, fix issues before they become crises, and continuously improve instead of letting their sites decay. Think of it as preventative maintenance: a little tracking now saves you from major headaches later.
3
Establishing a Baseline Before You Change Anything
You cannot track audit progress if you do not know where you started. This is why establishing an audit baseline is the most critical step in the entire process. Once your initial audit is completed, you can declare the baseline established and begin the improvement journey.
Record Your Initial Audit Findings
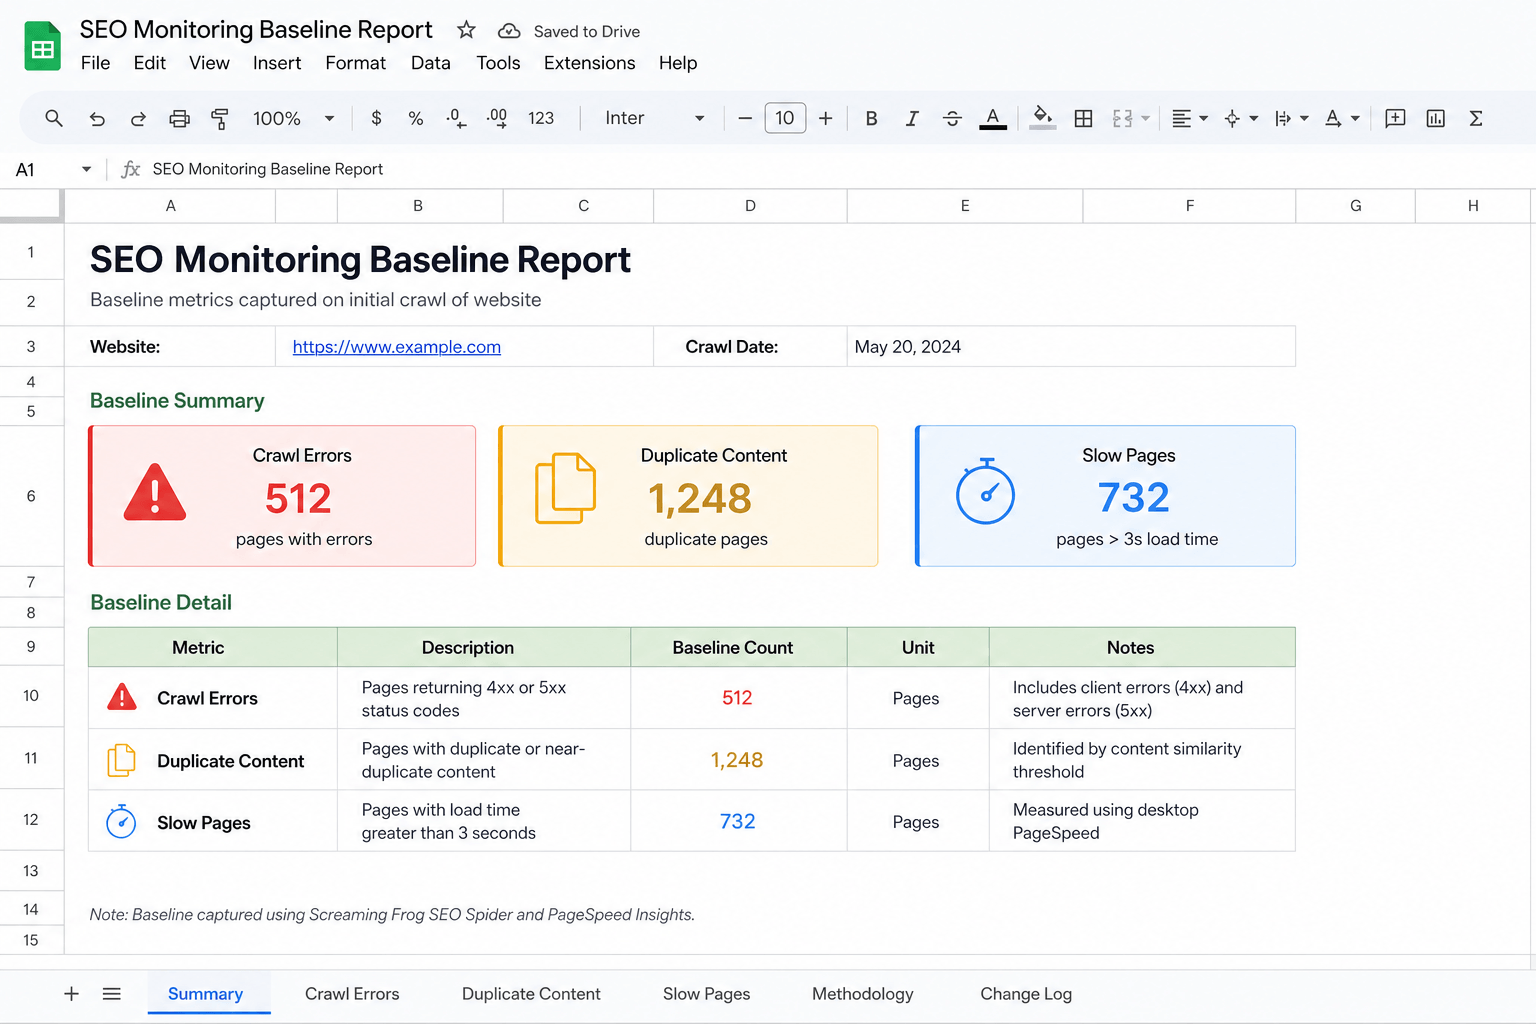
Run a comprehensive crawl of your entire website and document everything. Do not skip anything. Pay attention to audit coverage so you do not miss important sections. Make sure you record:
- Total number of pages crawled — your baseline value for coverage.
- Number of crawl errors found — record the metric value for each category.
- Number of warning notifications received — track the historical value for future comparison.
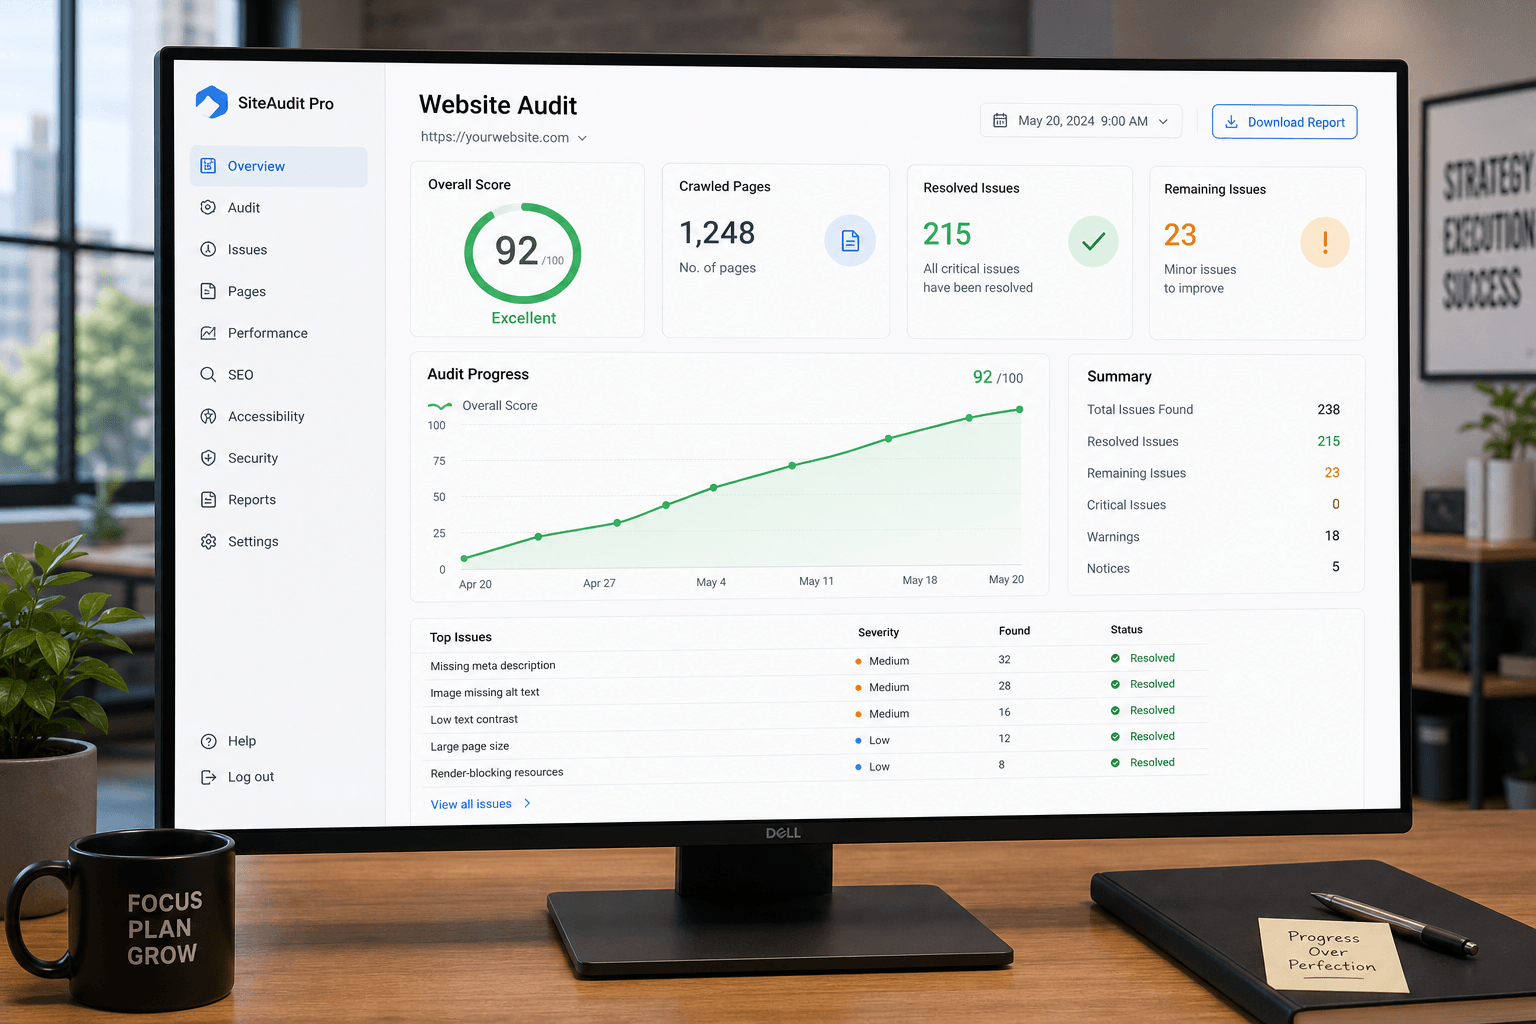
- Overall website health score — your starting performance score and the reference point for every future comparison.
Document and Prioritize Critical Issues
Not all issues are created equal. Some hurt your rankings immediately; others are minor annoyances. Create a prioritized list and assign a priority level (Critical, High, Medium, Low) and a severity level (Severe, Moderate, Minor) to each issue.
| Priority | Severity | Example Issues | Action |
|---|---|---|---|
| Critical (Level 1) | Severe | Pages blocked from crawlers, broken XML sitemap, major crawl errors | Fix now |
| Important (Level 2) | High | Duplicate content, missing meta descriptions, slow page load time | Fix soon |
| Nice to fix (Level 3) | Moderate | Minor accessibility gaps, outdated internal links | When time allows |
Capture Key Performance Metrics
Your audit tool gives you technical SEO metrics, but you also need performance data from analytics platforms. Gather historical data on:
- Organic traffic from Google Search Console or Google Analytics (record traffic volume)
- Organic sessions and visitor counts (track session and user counts)
- Average keyword rankings for your top 20 target keywords (note each ranking position)
- Conversion rate for key pages (your starting conversion rate)
- Bounce rate by page type (a key user engagement metric)
Set Measurable Objectives
Now that you know where you stand, set specific, measurable goals. Instead of saying "improve site speed," say: "Reduce homepage load time from 3.5 seconds to under 2 seconds within 60 days." That gives you a clear goal-attainment target — and when you hit it, you can mark Target Exceeded or Goal Achieved.
4
Key Metrics to Track After a Website Audit
Tracking everything is impossible. You need to focus on the metrics and progress indicators that actually matter. Here are the most important ones to watch.
Organic Traffic Trends
The lifeblood of most sites. Watch traffic direction over weeks, not day-to-day swings. A single bad day is noise; a downward trend over several weeks is a warning sign. Account for seasonal variation.
Keyword Rankings
Focus on 20–50 key terms, not every keyword. Track ranking position over time and watch for movement. Success looks like Top 3 Rankings Achieved or at least First Page Rankings across the board.
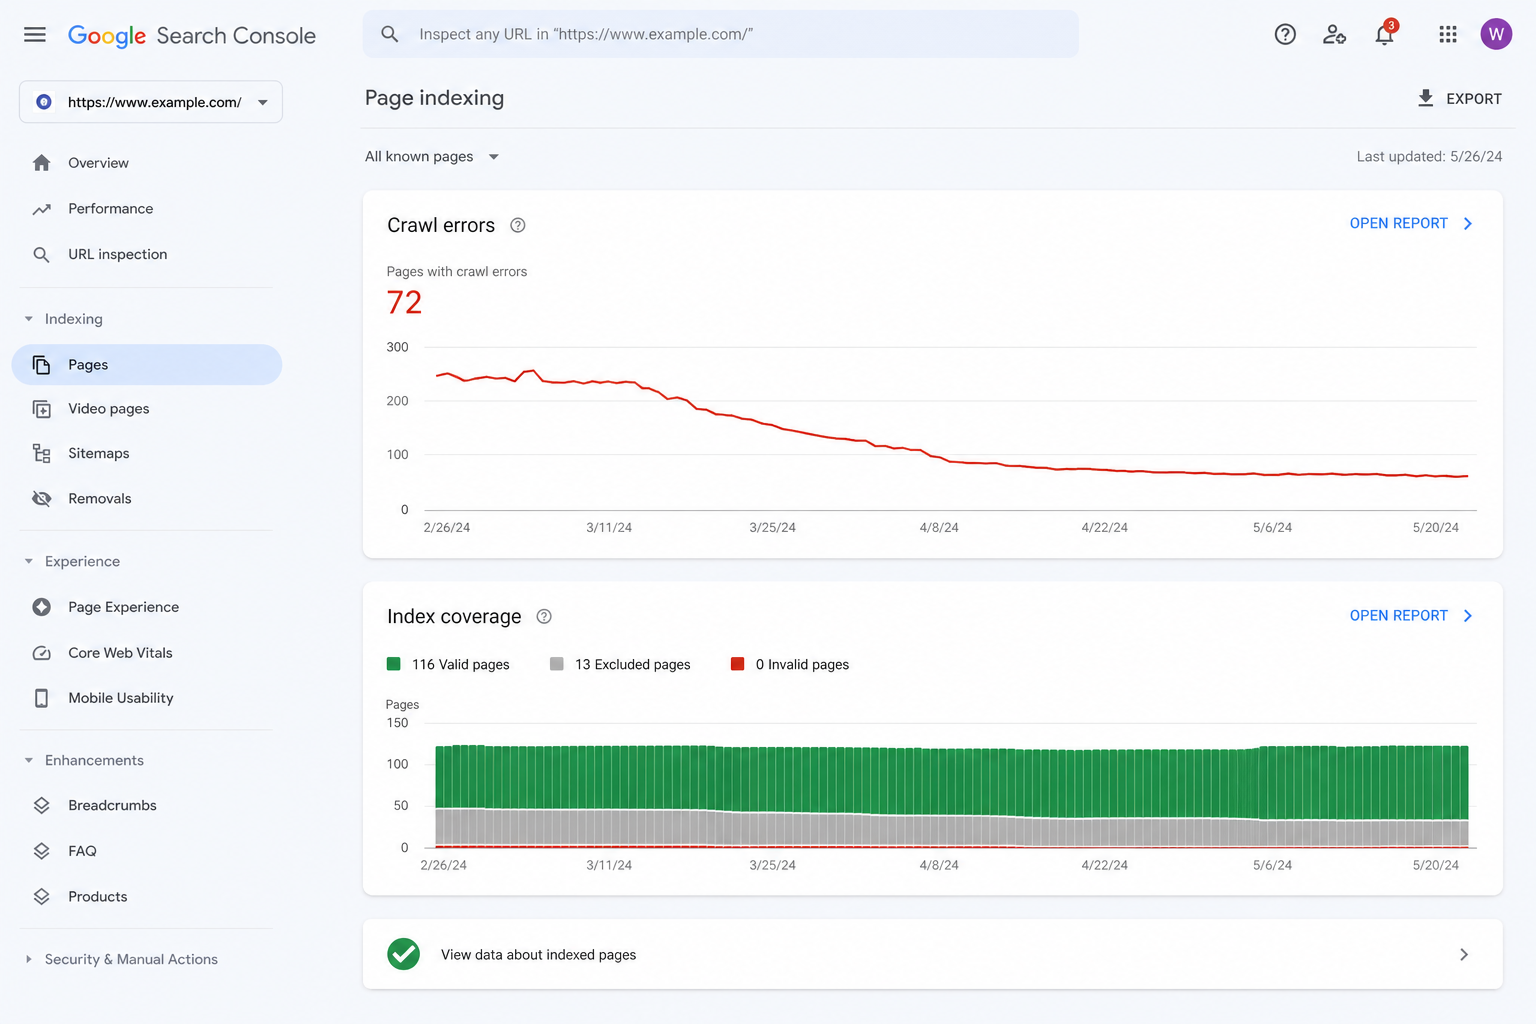
Crawlability & Indexability
If crawlers cannot access and index your pages, you will not rank. Period. Track crawl errors, index coverage, and error resolution status until you reach Crawl Errors Eliminated.
Page Speed
A confirmed ranking factor, especially on mobile. Track load time and server response time. Aim for Load Time Under 2 Seconds (excellent) or Under 3 Seconds (acceptable).
Conversion Rate
At the end of the day, your site needs to convert visitors into leads, sales, or subscribers. Connect technical fixes to goal completion rate and revenue contribution.
Bounce & Engagement
High bounce rates often signal slow pages or poor UX. Track session duration, pages per session, and engagement rate as direct measures of visitor satisfaction.
Backlink Profile
Monitor referring domains, link quality, link authority, and toxicity level. Your authority score should climb as you build quality links and disavow toxic ones.
Mobile Usability
More than half of visitors are on mobile, and Google indexes mobile-first. Track viewport config, tap target sizes, font legibility, and mobile performance scores separately from desktop.
Core Web Vitals — Google's User-Centric Metrics
Core Web Vitals are Google's specific page speed and user experience metrics. They directly impact rankings and are part of Google's user-centric performance rating. There are three:
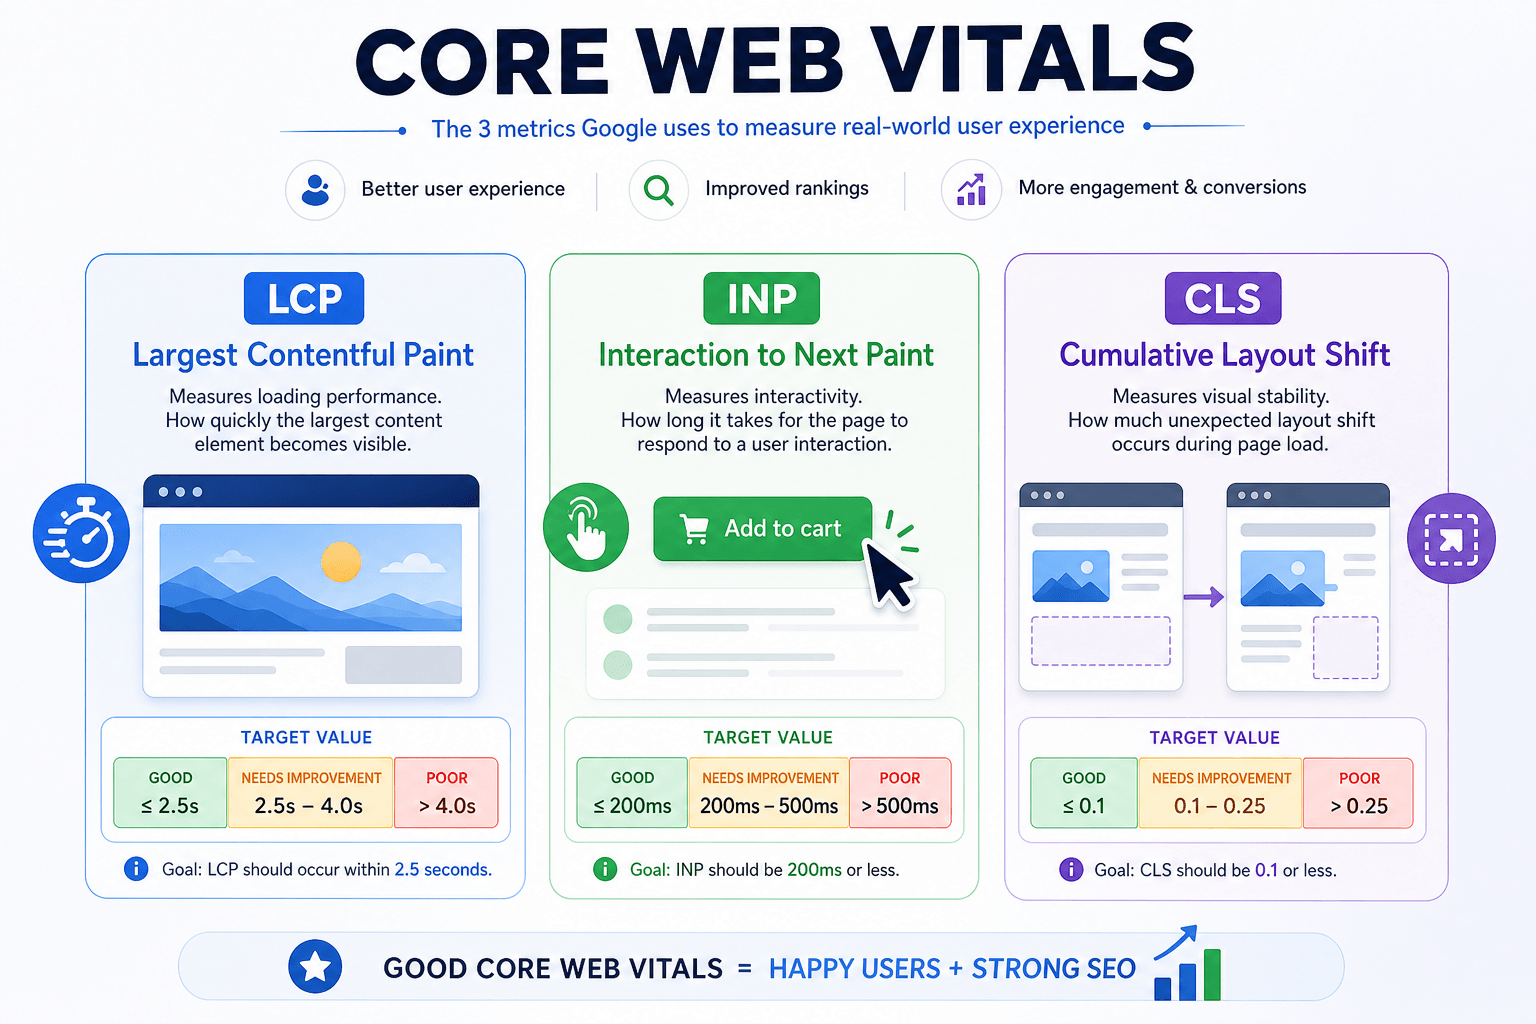
| Metric | What It Measures | Good Threshold |
|---|---|---|
| Largest Contentful Paint (LCP) | Loading performance — time until the main content loads | Under 2.5 seconds |
| Interaction to Next Paint (INP) | Interactivity — responsiveness to user input (replaces FID) | Under 200 ms |
| Cumulative Layout Shift (CLS) | Visual stability — how much the page moves while loading | Under 0.1 |
Together these determine your loading experience, visual stability, and responsiveness. The ultimate win is Core Web Vitals Passed across all your important pages. Track First Contentful Paint (FCP) and Total Blocking Time (TBT) as supporting metrics, and always measure mobile and desktop separately — they can differ significantly.
5
Categorizing Audit Findings for Easier Tracking
A raw audit report can contain hundreds or even thousands of issues. Trying to track them all individually is a recipe for burnout. Categorization saves you. Group your findings into clear buckets and track each group as a whole.
Technical SEO Issues
Crawl errors, broken links, redirect chains, canonical problems, XML sitemap issues, robots.txt accessibility, HTTP status errors, structured data validity. Usually highest priority — they block everything else.
On-Page SEO
Missing or duplicate title tags and meta descriptions, improper heading structure, thin content, keyword cannibalization. Usually faster to fix than technical issues.
Content-Related
Outdated content, content gaps, low-performing pages, duplicate content, search intent mismatches. Track content freshness and update frequency.
User Experience (UX)
Confusing navigation, poor internal links, intrusive popups, hard-to-use forms, weak calls to action. These hurt conversions and indirectly hurt SEO.
Security Concerns
Missing SSL, mixed content, outdated software, open redirects, exposed data. Always your absolute highest priority — vulnerabilities can get you delisted.
Structured Data & Internal Linking
Missing schema markup, rich-result eligibility, orphan pages, pages too far from the homepage. These improve discoverability and click-through rate.
6
Building a Website Audit Tracking System
You have your baseline and you know what to track. Now you need a system to manage it all. The right setup depends on your team size.
Tracking Spreadsheets
A well-designed spreadsheet is often the best tool for small to medium websites — flexible, accessible, and free. Create columns for:
- Issue description and category
- Priority level (Critical, High, Medium, Low) and severity level
- Date discovered and task owner
- Task status (Not Started, In Progress, Fixed, Verified)
- Completion percentage (0%, 25%, 50%, 75%, 100%)
- Resolution time and notes on the solution
Update it on a consistent schedule (weekly is ideal). It becomes your single source of truth.
The Five-Level Status Tracker
Use a simple status system everyone understands. I recommend these five levels:
| Status | Meaning | Completion |
|---|---|---|
| 1. Identified | The issue has been discovered and documented | 0% Complete |
| 2. Assigned | Someone has taken responsibility for fixing it | 0% Complete |
| 3. In Progress | Work has begun on the solution | 25–75% Complete |
| 4. Fixed | The issue has been addressed and awaits verification | ~90% Complete |
| 5. Verified | A fresh audit confirms the issue is gone | 100% Complete |
Prioritize With the Impact vs. Effort Matrix
Quick Wins First
High impact, low effort: Do these first.
High impact, high effort: Plan for your next sprint.
Defer or Skip
Low impact, low effort: Do when you have spare time.
Low impact, high effort: Skip unless there is a specific reason.
Assign Clear Ownership
Every issue needs an owner, or things fall through the cracks. Developers own technical SEO issues, content teams own meta and title issues, UX designers own usability issues. Clear ownership creates accountability — when something is not getting fixed, you know exactly who to talk to. For larger teams, project management tools like Asana, Trello, or Jira add real-time visibility and let you enable workflow automation.
7
Setting Milestones and Progress Benchmarks
Tracking is easier when you have clear milestones to aim for. Break long-term goals into smaller, achievable chunks across three horizons.
Short-Term (0–30 days)
Quick wins and critical issues. Fix all crawl errors on the homepage and top 10 landing pages. Update meta descriptions on your 50 most-visited pages. Resolve mobile usability errors. Target 100% completion.
Medium-Term (30–90 days)
High-impact, moderate-effort issues. Reduce site crawl errors by 75%. Improve average load time from 3.2s to 2s. Increase pages with structured data from 15% to 80%.
Long-Term (3–12 months)
Big-picture objectives. Reach a health score of 95+ (up from 72). Get all key pages passing Core Web Vitals. Increase organic traffic 50% year over year.
Run Regular Benchmark Reviews
Set aside time at the end of each month for a structured review. This is not optional — it is the core of your tracking system. During each monthly review, ask:
Every quarter, go further: run a full audit and compare it to your baseline from three months ago. Look for Quarter-over-Quarter Improvement, watch for seasonal variation, and adjust your strategy before you waste another three months on something that is not working.
8
Monitoring Technical SEO Improvements Over Time
Technical SEO forms the foundation of everything else. If search engines cannot crawl and index your site, nothing else matters. Here is what to watch.
9
Tracking Content Optimization Progress
Content issues are often the most numerous in any audit report — but they are also the most visible to your audience. Fixing them directly improves user experience and organic traffic.
Updated Content Performance
When you update old blog posts or service pages, track how their performance changes. For each updated page, compare the 30 days before versus the 30 days after:
- Organic traffic volume and traffic growth percentage
- Session duration (a measure of engagement improvement)
- Bounce rate (track the percentage change)
- Keyword rankings for the page's primary target keywords
Keep a content inventory log. Over time you will learn which types of updates drive the biggest performance gains. Success means Content Updated, Content Freshness Improved, and Content Performance Improved.
Content Gap Closure
A content gap is a topic your audience searches for that your website does not address well. List every identified gap, then mark which ones you have closed with new or improved content. Track completion rate until you reach Content Gap Closed, Keyword Coverage Improved, and Search Intent Matched.
10
Measuring User Experience Improvements
User experience and SEO are increasingly connected. Google can measure how visitors interact with your site, and good UX leads to good engagement signals, which support good rankings.
Page Load Time
Every one-second delay can reduce conversions by up to 20%. Track load time and server response on your homepage, top product pages, and checkout/form pages using PageSpeed Insights or Lighthouse.
Mobile Responsiveness
Track viewport config, tap target sizes, readable fonts, and no horizontal scrolling. Use the Search Console Mobile Usability report and track mobile scores separately from desktop.
Navigation
Measure click depth (clicks from homepage to important pages — shorter is better), site-search usage, and bounce rate on key pages. Aim for Easier Site Navigation and an enhanced user journey.
Engagement Signals
Track dwell time, pages per session, and exit rates. These tell search engines whether visitors find your site valuable. Goal: Improved Engagement and Higher User Satisfaction.
Conversion Funnel Performance
Your conversion funnel is the path visitors take to become leads or customers. UX problems at any step can kill conversions. Track drop-off at each stage — landing page to product, product to cart, cart to checkout, checkout to confirmation. Speeding up your checkout by one second might lift goal completions by 10%. Aim for Better Funnel Performance.
11
Tracking Website Health Scores
Many SEO tools provide a single website health score that summarizes your site's condition. While not perfect, these scores are useful for tracking high-level progress. Track health score, error count, warning count, and critical issue count together.
| Health Score | Rating | What It Means |
|---|---|---|
| 90–100 | Excellent | Strong technical foundation; maintain and monitor |
| 80–89 | Good | Solid, with a few items to tidy up |
| 70–79 | Fair | Clear room for improvement |
| Below 70 | Poor | Requires immediate attention |
12
Using Reports to Measure Progress Consistently
Historical data is useless if you never look at it. Regular reporting keeps everyone aligned and accountable. Match the report to the audience.
Weekly Reports
Quick and focused, for the people doing the work. Resolved issues this week, new issues found, current health score, milestone progress, and any blockers. Keep it to one page or a team-chat update.
Monthly Reports
More comprehensive, for managers and clients. Health-score trend, top 5 improvements made, top 5 remaining issues, KPI changes, and progress toward monthly goals.
Stakeholder Reports
Focus on outcomes, not activities. A headline metric, 2–3 key wins with business impact, and revenue/traffic/conversion changes. They care about results, not how many redirects you fixed.
13
Common Challenges (and How to Fix Them)
Tracking sounds simple in theory. In practice, you will hit obstacles. Here are the most common ones and how to solve them.
14
Best Practices for Long-Term Tracking
Establish Regular Review Cycles
Consistency beats frequency. A weekly review that actually happens is better than a daily one you abandon. Put it on the calendar and treat it as non-negotiable.
Automate Reporting
Manual reporting is slow and error-prone. Schedule automatic audits, automated reports, and alerts for new critical issues. Set it up once and save hours every month.
Maintain Historical Records
Keep every audit you ever run — never delete old ones. Use a consistent naming scheme like domain_audit_YYYY_MM_DD so you can compare any two points in time.
Update Benchmarks Periodically
As your site improves, raise the bar. A score of 80 that once seemed impossible should become your new floor. Re-evaluate benchmarks every quarter against industry standards.
Prioritize High-Impact Issues
Tracking tempts you to chase small wins. Do not spend an hour on a low-impact issue while a high-impact one waits. Always ask: will fixing this meaningfully improve performance or UX?
Keep the Team Aligned
Clear roles prevent confusion. Everyone should know which issue categories they own. Define communication workflows and tailor reports to each audience.
15
Signs Your Audit Efforts Are Working
How do you know all this tracking is worth the effort? Look for these positive signals — when several show up together, your audit efforts are clearly paying off.
Increased Organic Visibility
You rank for more keywords and gain search impressions for both branded and non-branded queries. Higher Organic Visibility and Sustained Traffic Growth.
Reduced Technical Errors
Error and warning counts drop month over month. Issues that used to recur stop appearing. Your health score trends upward from red to yellow to green.
Improved Engagement
Visitors stay longer, view more pages, and bounce less on key landing pages. Return-visitor rates climb.
Better Rankings
Pages on page 3 move to page 1; page-1 pages move into the top 3. Look for Ranking Improved by 5 or 10 Positions on key terms.
More Conversions & Leads
Goal completions rise, purchases increase, signups grow. Your organic conversion rate improves. Conversion Targets Achieved.
Faster Performance
Load times drop and Core Web Vitals shift from "Poor" to "Needs Improvement" to "Good." Performance Bottlenecks Removed.
16
Audit Tracking Glossary
| Term | Definition |
|---|---|
| Audit Baseline | Your initial measurements before any changes. Every comparison starts here. |
| KPI Tracking | Monitoring the few key performance indicators that matter most to your goals. |
| Benchmarking | Comparing your metrics against industry standards or your own past data. |
| Issue Resolution Rate | The percentage of identified issues you have fixed — a core measure of execution. |
| Website Health Score | A single 0–100 number summarizing your site's overall condition. |
| Core Web Vitals | Google's LCP, INP, and CLS metrics for loading, interactivity, and visual stability. |
| Regression | A previously fixed issue that has returned — often after a site update. |
| Index Coverage | How many of your pages are included in Google's index. |
| Crawl Budget | The number of pages search engines will crawl on your site in a given period. |
| Content Gap | A topic your audience searches for that your site does not yet address well. |
17
Frequently Asked Questions
For most websites, running a full audit once per month is sufficient. High-traffic sites or sites that change frequently may benefit from weekly audits. At minimum, run an audit quarterly. Your audit frequency should match how often your site changes — and you should keep continuous monitoring enabled between full audits to catch regressions early.
Scores vary by tool, but generally 80 or higher is good and 90+ is excellent. However, the trend matters more than the absolute number. A site improving from 60 to 75 is doing better than a site dropping from 90 to 85. If your score is below 70, that requires immediate attention. Focus on the health trend rather than any single reading.
Timing varies by issue type. Technical fixes — like repairing a broken XML sitemap — can show results in days. Content optimization improvements often take 4 to 8 weeks to impact rankings. Major structural changes can take 3 to 6 months to fully materialize. Be patient and look for improving trends rather than immediate jumps.
Yes, up to a point. Google Search Console provides crawl-error tracking, index coverage, and Core Web Vitals data for free, and Google Analytics tracks organic traffic and engagement. Dedicated tracking software offers more comprehensive audit-comparison features, but you can get a long way with free tools. Always verify your data before making major decisions.
Critical issues (errors) directly harm your SEO or user experience and need immediate attention. Warnings are potential problems or best-practice violations that should be fixed but are less urgent. Track your critical issue count separately from your warning count so the urgent items never get buried under the minor ones.
Run a fresh audit after implementing your fix. If the issue no longer appears, it is resolved. If it still appears, either your fix did not work or you missed something. Always verify fixes with new data, then mark them as Verified, Approved, and Closed — only then should you consider them Completed Successfully.
18
Get a Comprehensive Website Audit from Webperts
Tracking audit progress is powerful — but it all starts with a thorough, accurate initial audit that follows a proven framework. Without a solid baseline, your tracking efforts will never reach their full potential. You need an Initial Audit Completed and a Baseline Established before anything else.
That is where Webperts comes in. We dig deep into technical SEO, on-page content, user experience, and site security using a systematic checklist that leaves no stone unturned — and we make sure your audit coverage is complete and your data is reliable.
Comprehensive Audit
Full technical, on-page, content, UX, and security audit with a complete, accurate baseline you can track against from day one.
Clear Priorities & Action Plan
We do not hand you jargon and walk away. We explain what findings mean and prioritise them as High, Medium, or Low based on real impact.
Ongoing Progress Tracking
Continuous monitoring, automated reporting, and real-time tracking so you can watch your website health trend upward with confidence.
Ready to Track Real Audit Progress?
The Webperts team — a leading website development and SEO company in Dubai — helps you establish a clear baseline, identify critical issues and performance bottlenecks, and build an action plan that delivers measurable results. We provide ongoing reports and dashboards so you always know exactly where your website stands.
Get Your Free Website Audit →Explore Our Web Services
19
Conclusion
Running a website audit is the easy part. The real value comes from what you do next — tracking your progress over time, verifying that your fixes actually worked, and catching new problems before they hurt your traffic.
The formula is simple but powerful: establish a clear baseline, focus on a handful of key metrics that map to your goals, build a consistent tracking system with regular review cycles, and let the trend line — not any single data point — guide your decisions. Do this and you stop guessing and start making data-driven improvements that compound month after month.
Websites that track their audit progress consistently outperform those that do not, because they treat optimisation as ongoing maintenance rather than a one-time project. Start with your baseline today, pick your five to ten KPIs, and put your first monthly review on the calendar. Your visitors — and the search engines — will thank you.