📱 In This Guide:
If you have ever wondered why your friend with an iPhone cannot download an app that works perfectly on your Android tablet, you are not alone. The difference between an iOS app and an Android app goes far beyond just the icon shapes or the color of the chat bubble. These two types of mobile applications are built on completely different foundations, from the programming languages used to create them to the stores where you download them and the way they handle your personal information.
Understanding these differences matters whether you are planning to build an app for your business, choosing a new smartphone, or simply curious about how technology works. We will walk through every major distinction between iOS and Android apps in a friendly, straightforward way. We will compare development costs, security features, customization options, and even how much money each platform tends to generate. By the end, you will know exactly which platform suits your needs.
1Introduction to iOS Apps and Android Apps
What an iOS App Is
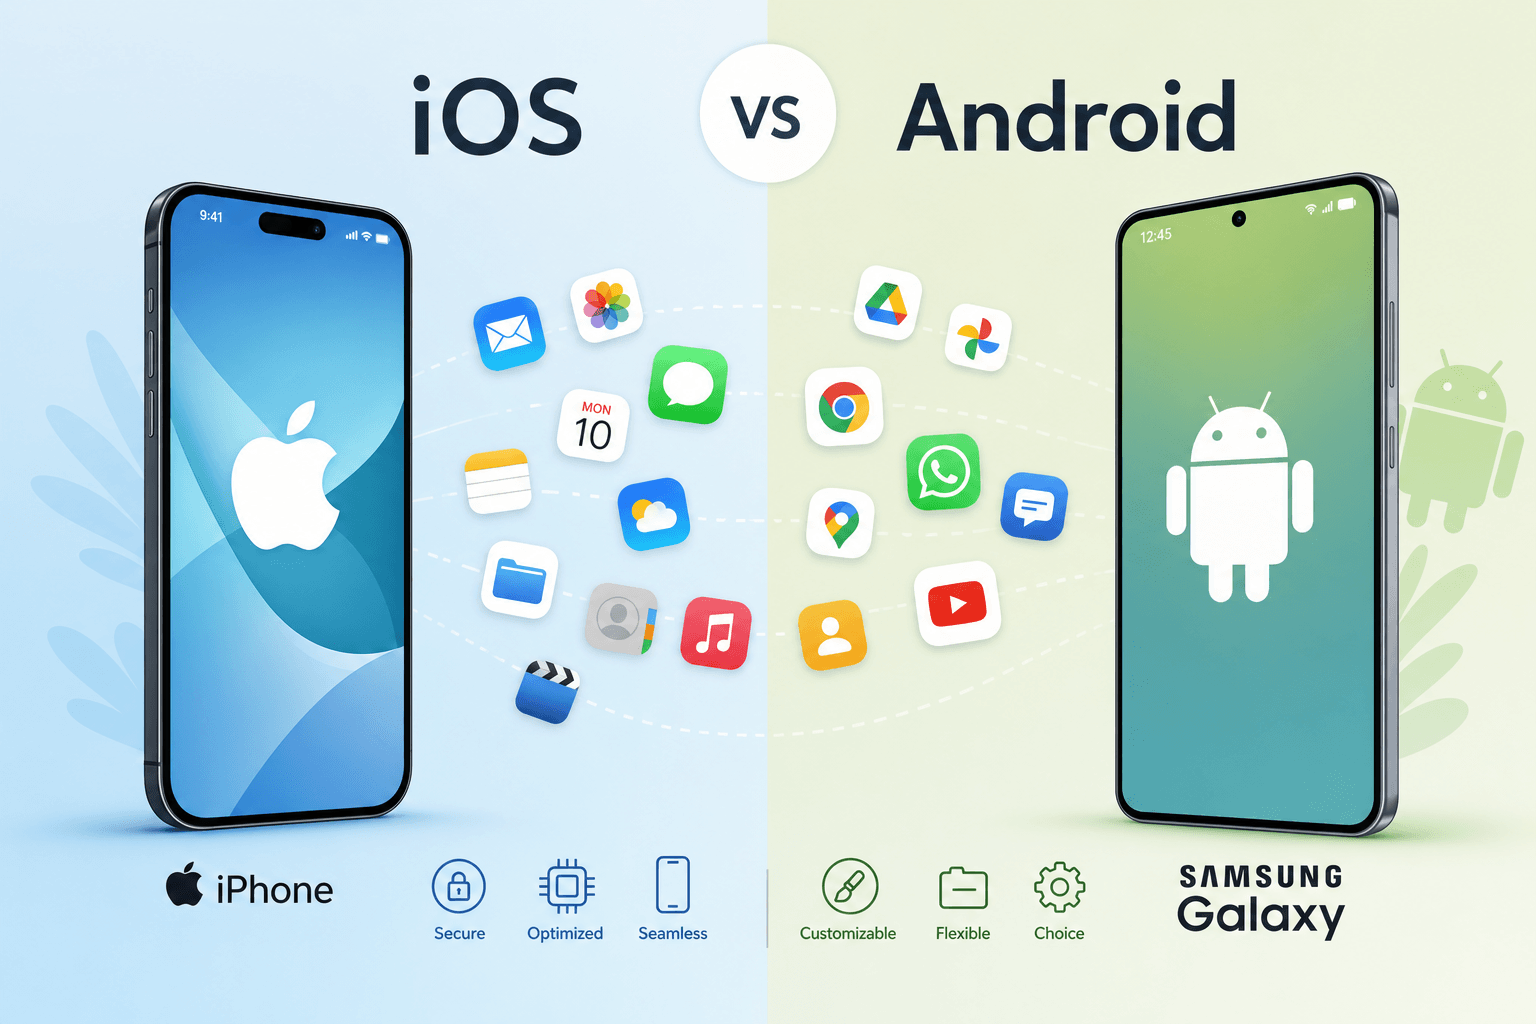
An iOS app is a software application designed specifically to run on Apple's mobile operating system. This platform places iOS apps within a closed mobile ecosystem where one company controls both hardware and software. Operating system ownership belongs entirely to Apple. User accessibility on iOS is streamlined and consistent across all devices, with the application purpose ranging from productivity to entertainment.
What an Android App Is
An Android app runs on Google's Android operating system, which is developed under the umbrella of Alphabet Inc. This platform operates within an open mobile ecosystem where multiple manufacturers participate. Operating system ownership is shared between Google (core development) and device manufacturers (customizations). User accessibility varies across devices but generally offers more entry points.
Why People Compare iOS and Android Apps
The comparison comes up constantly because these two platforms dominate the mobile world. Together, iOS and Android power over 99 percent of all smartphones globally. Choosing the wrong platform for your app idea can cost thousands of dollars and months of wasted development time.
The global mobile app economy generates over 500 billion dollars annually, and that number continues to grow. Knowing which platform to build on, or which phone to buy, starts with understanding these fundamental differences.
Understanding the Operating Systems
Introduction to Apple iOS
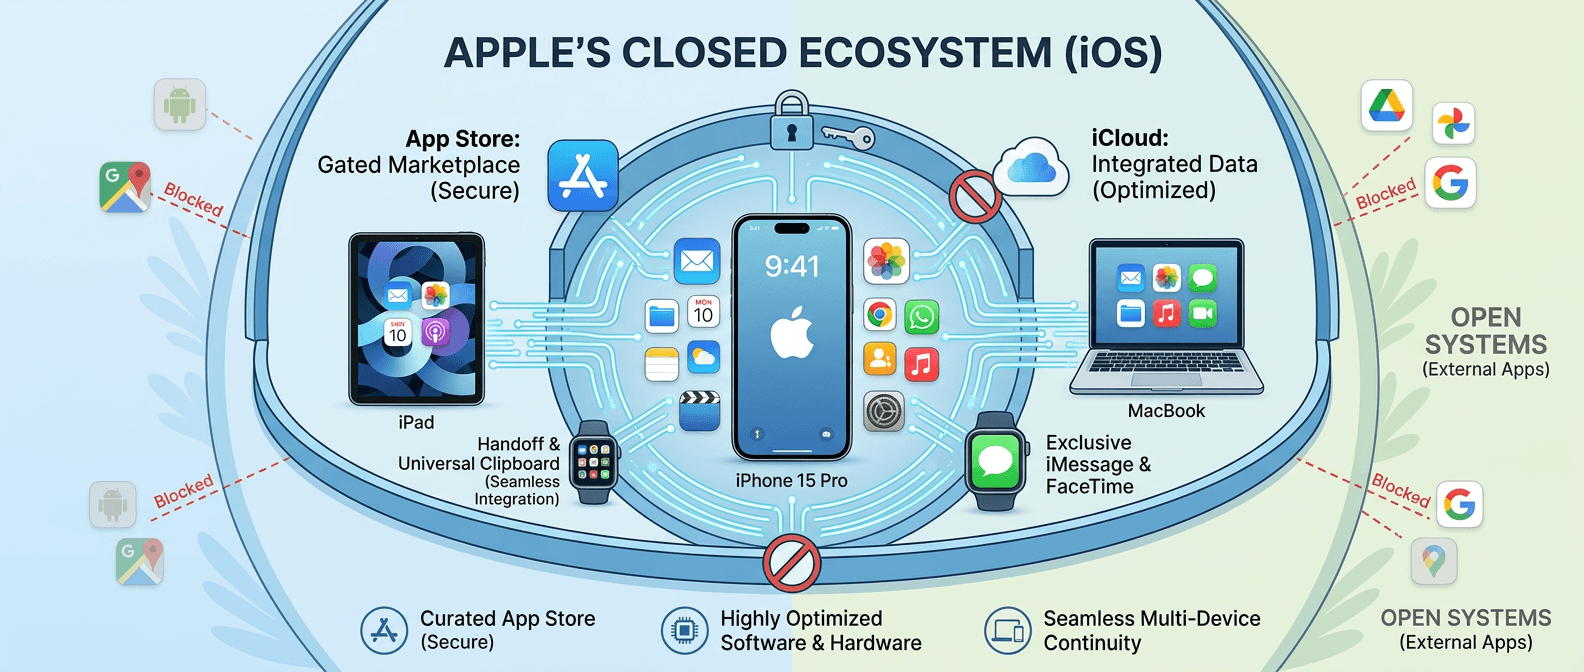
iOS first launched in 2007 alongside the original iPhone. Apple controls every aspect of iOS. The OS architecture uses a hybrid XNU kernel combining Mach and BSD elements. Source code is completely closed; only Apple engineers can view or modify the code. System flexibility is deliberately limited to ensure stability and security. Software integration is extremely tight, with Apple designing chips and OS together. Update control rests entirely with Apple, which pushes updates to all supported devices simultaneously.
Introduction to Android OS
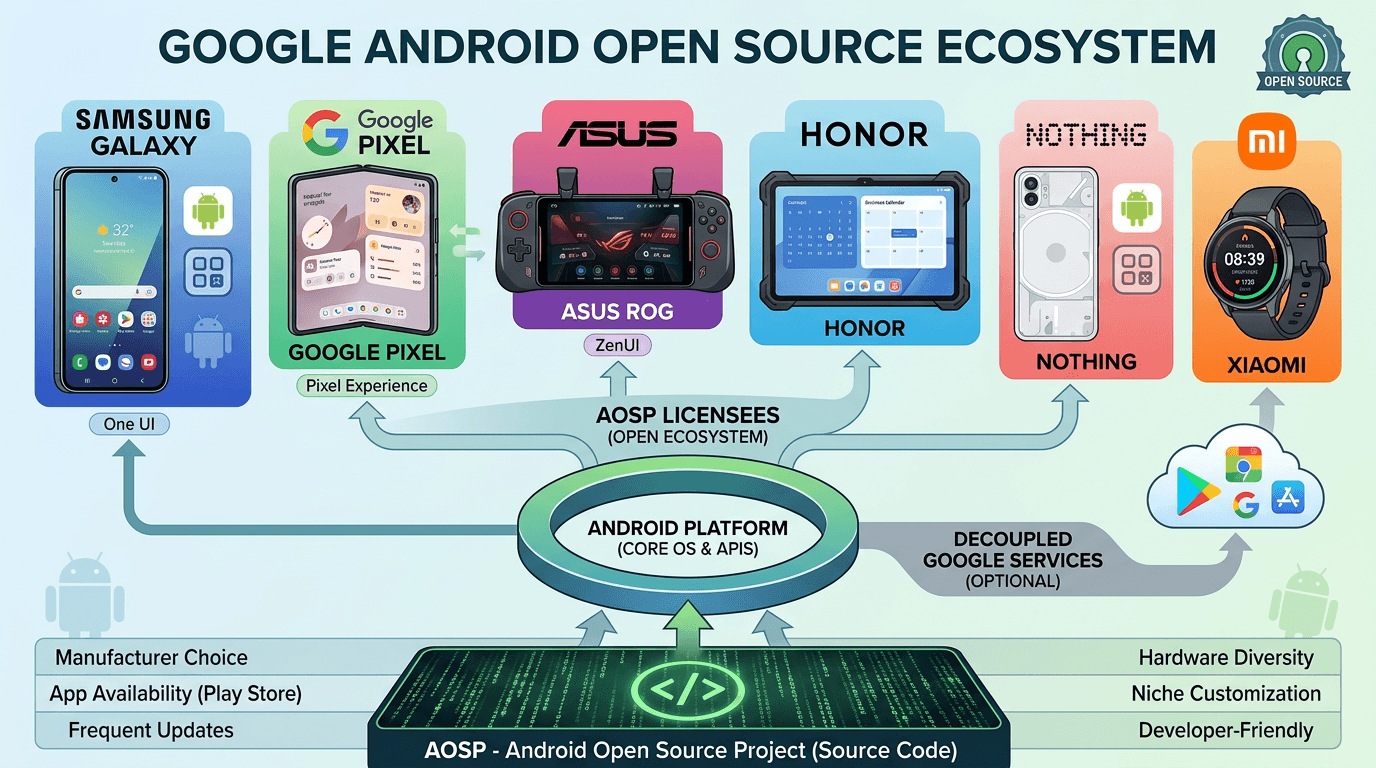
Android first appeared in 2008. Google develops the core operating system, but device manufacturers can modify it. The OS architecture uses a Linux kernel with modifications for mobile use. Source code accessibility is open through the Android Open Source Project (AOSP). System flexibility is extensive, allowing manufacturer customizations and user modifications. Update control is shared between Google (core updates) and manufacturers (device-specific updates). Ecosystem openness is high, supporting multiple app stores and sideloading.
Apple iOS
Closed source, hybrid XNU kernel. Apple controls all hardware and software. Updates pushed simultaneously to all supported devices. Minimal ecosystem openness by design.
Google Android
Open source via AOSP, Linux kernel. Hundreds of manufacturers run Android. Updates fragmented across manufacturers. Extensive ecosystem openness including sideloading.
Open-Source vs Closed Ecosystem
Android is open source through the Android Open Source Project. Anyone can view, modify, and distribute Android code. iOS is completely closed source. Only Apple can access and modify the operating system code. This open versus closed debate shapes everything from security to customization to app distribution.
Devices Supported by Each Platform
Apple Devices Supporting iOS Apps
Device compatibility for iOS apps is limited to Apple hardware. Screen size adaptability is straightforward because only a handful of screen dimensions exist. Device variety is low, with roughly 25 iPhone models actively supported. iOS apps run on iPhone models from iPhone SE through the iPhone 17 series, iPad models, and Apple Vision Pro in compatibility mode.
Android Smartphones and Tablets
Device compatibility for Android apps spans thousands of models. Hardware support varies by manufacturer, with different sensors, cameras, and chips. Screen size adaptability is complex, ranging from small budget phones to large tablets to foldable devices.
Android apps run on devices from Samsung Galaxy, Google Pixel, OnePlus, Motorola, Nokia, Sony, Xiaomi Redmi, Oppo, Vivo, Realme, and dozens more. Tablets from Samsung Galaxy Tab series, Lenovo, and Amazon Fire also run Android apps.
User Interface and User Experience Differences
Apple Human Interface Guidelines
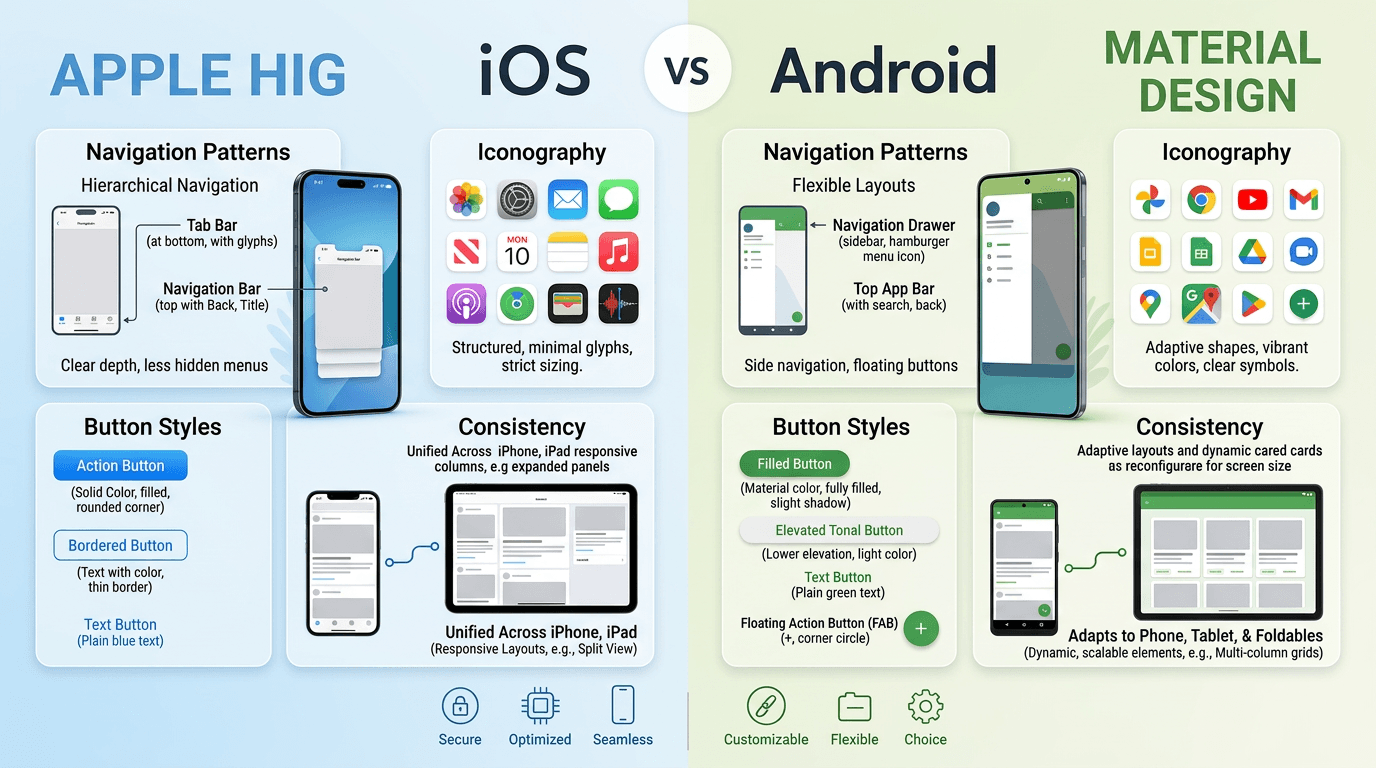
Apple requires apps to follow specific design rules called the Human Interface Guidelines. Interface consistency across iOS apps is exceptionally high because all developers follow the same rules. Navigation style relies on tab bars, back buttons in the top left, and edge swipes. Gesture support is standardized. Visual design language emphasizes clarity, depth, and subtle animations. Accessibility support includes VoiceOver, Dynamic Type, and Switch Control built into the system.
Android Material Design Principles
Google introduced Material Design in 2014 and continues to evolve it. Interface consistency varies because manufacturers customize Android and developers have more freedom. Navigation style uses system back buttons or gestures, with a bottom navigation bar common in many apps. Visual design language emphasizes bold colors, responsive animations, and depth effects like shadows. Personalization capability is extensive, allowing users to change launchers, icon packs, and system themes.
 AI-generated image, please ignore any text errors.
Navigation Differences
iOS apps typically place back buttons in the top left corner or rely on swiping from the left edge. Android apps use a system back button either on screen or through gesture navigation. Android users expect a consistent back behavior across all apps, while iOS users expect app-specific back logic.
Design Consistency Across Devices
An iOS app looks nearly identical on an iPhone SE and an iPhone 17 Pro Max, just scaled appropriately. An Android app might look one way on a Samsung Galaxy phone, differently on a Google Pixel tablet, and completely different on a foldable device in expanded mode. Good Android design requires responsive layouts that adapt to many configurations.
App Development Languages and Technologies
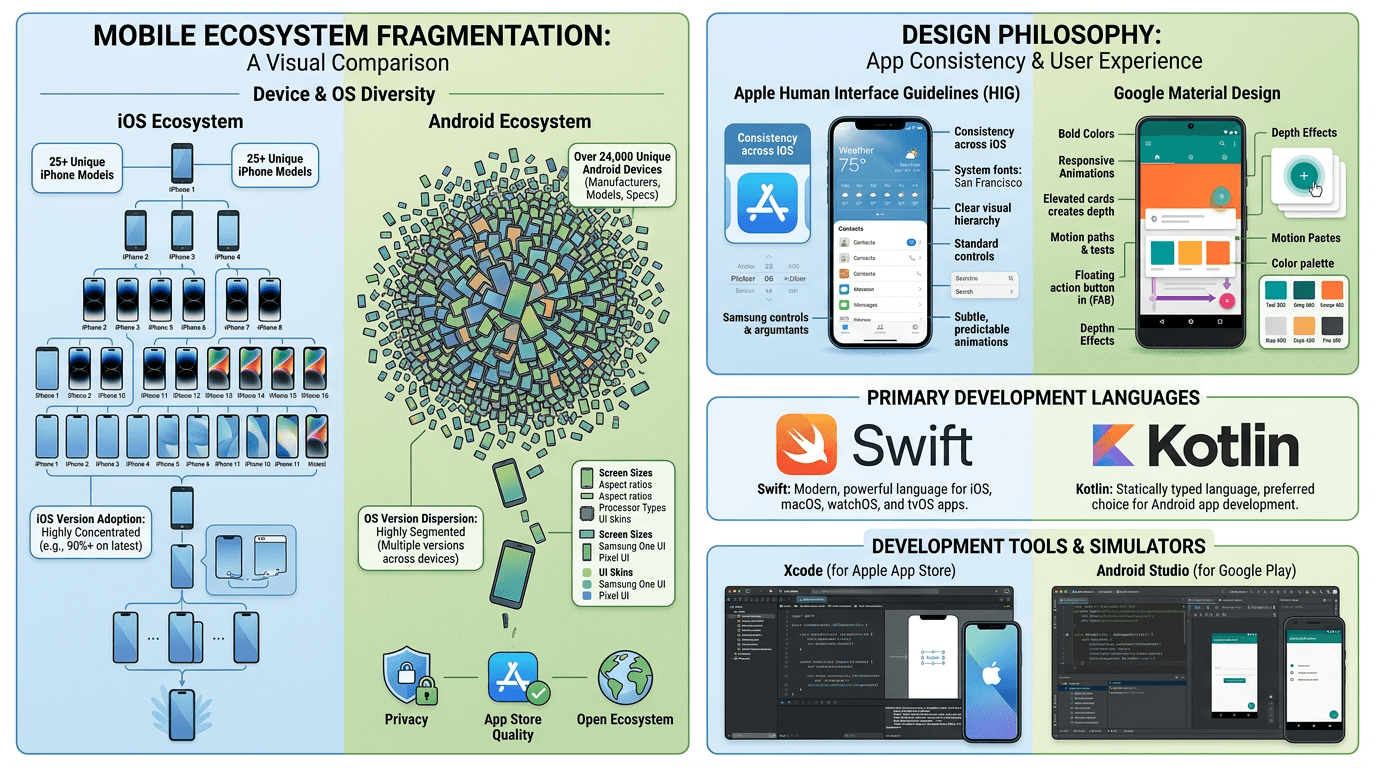
Swift for iOS Development
Apple introduced Swift in 2014 as a modern, safe, and fast programming language. The learning curve is moderate; developers with prior coding experience pick it up in weeks. Syntax simplicity is a strength of Swift, with clean, readable code. Performance efficiency is high because Swift compiles to optimized native code. Framework support includes SwiftUI, UIKit, Combine, and all Apple SDKs.
Kotlin for Android Development
Google made Kotlin the preferred language for Android development in 2019. The learning curve is low for developers familiar with Java. Syntax simplicity is a key advantage of Kotlin, which reduces boilerplate code significantly. Performance efficiency matches Java while offering additional safety features. Framework support includes Jetpack Compose, Coroutines, and all Android SDKs.
Swift (iOS Native)
Introduced 2014. Clean syntax, excellent performance. Powers SwiftUI and UIKit. Best choice for all new iOS projects.
Kotlin (Android Native)
Google's preferred language since 2019. Reduces boilerplate vs Java. Powers Jetpack Compose. Interoperates fully with Java codebases.
React Native (Cross-Platform)
JavaScript-based, backed by Meta. Renders native components. 80–90% code reuse across iOS and Android. Good for teams already using React.
Flutter (Cross-Platform)
Dart-based, backed by Google. Draws every pixel itself. 90–95% code reuse. Very good performance. Also targets web and desktop.
Cross-Platform Technologies Overview
Cross-platform app tools let you write code once and deploy to both iOS and Android. Popular options include React Native (JavaScript, backed by Meta), Flutter (Dart, backed by Google), and .NET MAUI (C#, backed by Microsoft). These tools save time but can introduce performance overhead and platform limitations.
Development Tools Comparison
Xcode for iOS Development
Xcode is Apple's free integrated development environment. IDE functionality includes code editing, interface builder, debugger, performance instruments, and source control. Xcode uses a simulator rather than an emulator, which is fast but cannot replicate all hardware behaviors. The iOS SDK releases once per year alongside the new iOS version.
Android Studio for Android Development
Android Studio is Google's free IDE based on IntelliJ IDEA. IDE functionality includes visual layout editor, APK analyzer, code completion, refactoring tools, and build system integration. Android Studio uses emulation rather than simulation, which is slower but more accurate. The Android SDK updates more frequently, sometimes monthly.
Xcode's debugger (LLDB) integrates seamlessly with Swift and Objective-C. Android Studio uses the Android Debug Bridge (ADB) plus Java Debug Wire Protocol (JDWP). Both platforms include excellent performance profiling tools: Xcode's Instruments suite and Android Studio's CPU, memory, network, and energy profilers.
App Store Distribution Differences
Apple App Store Process
Submitting an iOS app requires a $99 USD per year Apple Developer account. The approval process is thorough, with manual review by Apple employees. Publishing speed averages 24 to 48 hours for initial review. Store policy strictness is very high; Apple enforces detailed guidelines on design, functionality, and content. Apple rejects about 40 percent of submitted apps for guideline violations.
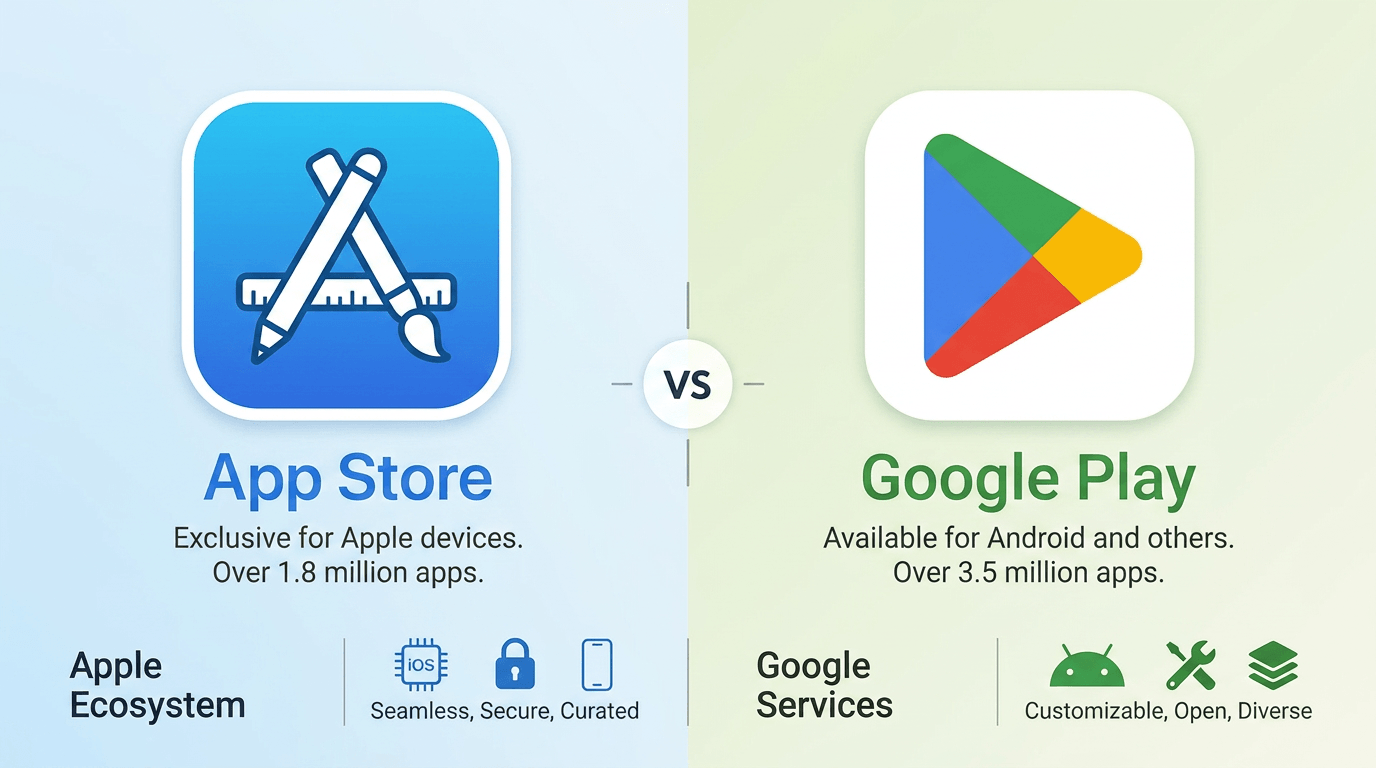
Google Play Store Process
Submitting an Android app requires a $25 USD one-time registration fee for a Google Play Developer account. The approval process combines automated checks with selective human review. Publishing speed ranges from hours to several days depending on app complexity and developer history. Distribution accessibility allows multiple stores including Amazon Appstore and Samsung Galaxy Store.
Apple App Store
Cost: $99/year • Review: Manual, 24–48 hrs • Distribution: App Store only • Beta: TestFlight (10,000 testers)
Google Play Store
Cost: $25 one-time • Review: Automated + selective, hours to days • Distribution: Multiple stores • Beta: Open track (unlimited)
Security and Privacy Differences
iOS Security Architecture
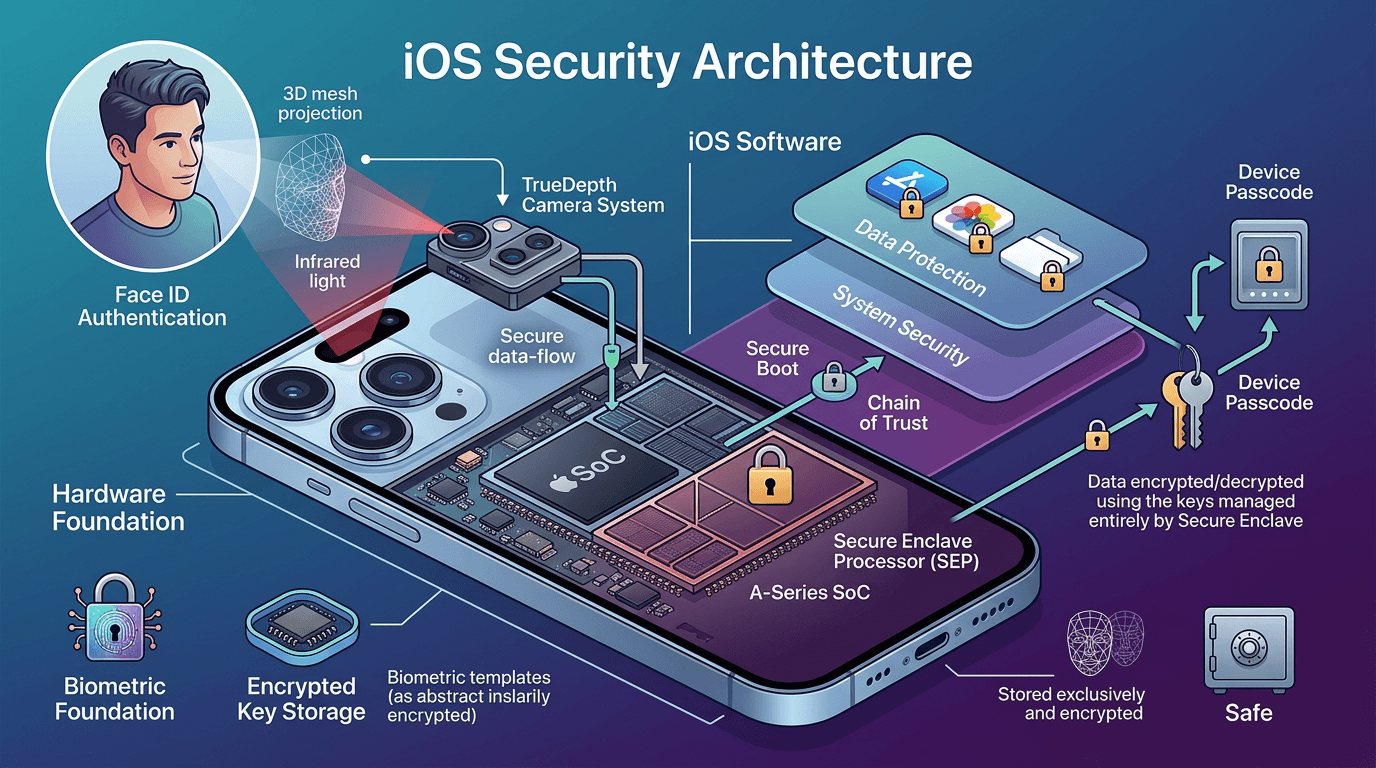
Apple designs security from the hardware up. Data encryption is mandatory and hardware-based using the Secure Enclave. Malware protection is strong due to code signing, app sandboxing, and the absence of sideloading. Permission control is granular, with apps requesting access at first use. Privacy transparency is excellent with App Privacy labels and tracking transparency requirements. Security updates arrive rapidly for all supported devices simultaneously.
Android Security Architecture
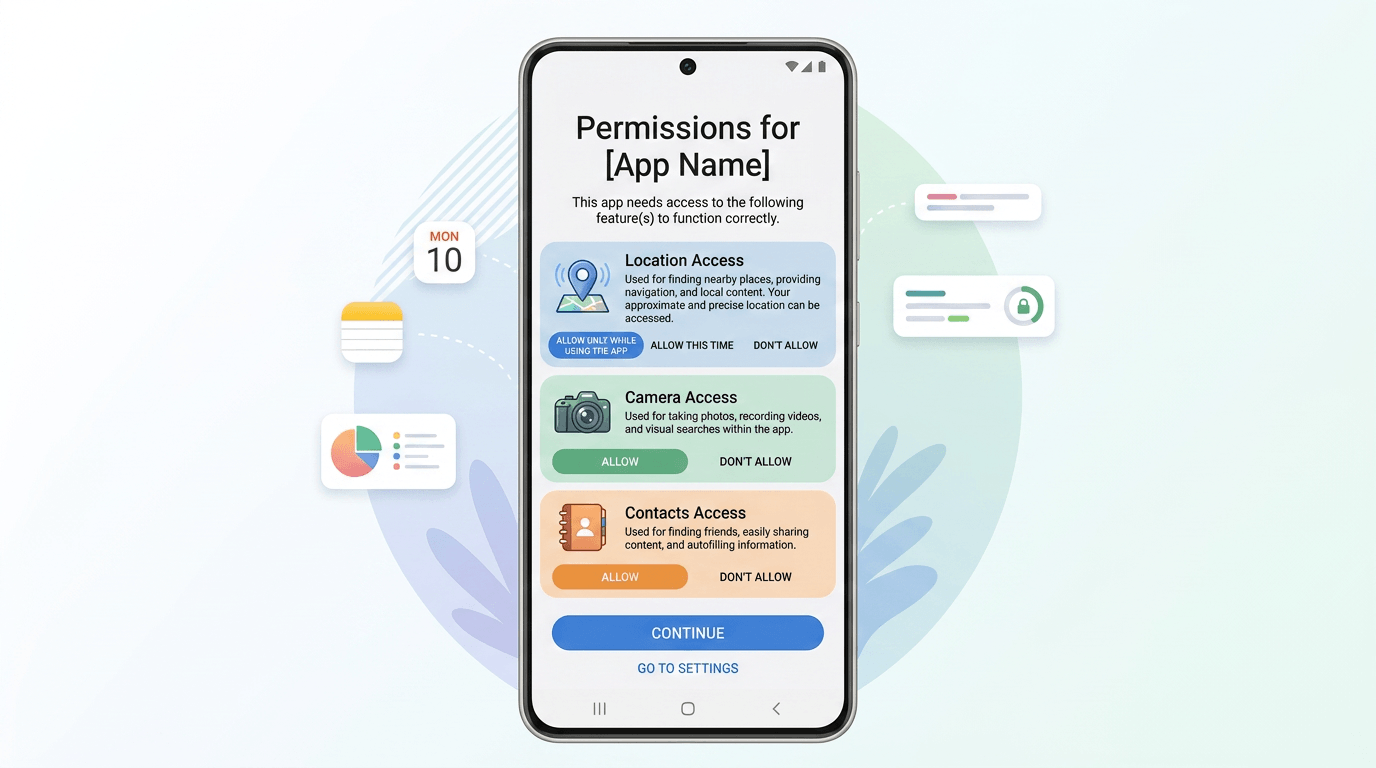
Android uses Linux kernel security features including SELinux and mandatory access controls. Data encryption is enabled by default on modern devices but implementation quality varies by manufacturer. Malware protection includes Google Play Protect scanning, but malware is more common due to sideloading and third-party stores. Security updates are fragmented; Google Pixel devices receive monthly patches while many devices lag months behind.
Encryption Differences
iOS encrypts all device data by default using hardware keys. You cannot disable this encryption. Android devices have encryption on by default as well, though some budget devices use weaker encryption or slower implementations. File-based encryption on Android allows some data to be accessible before device unlock, which iOS does not permit.
Performance and Optimization
Hardware-Software Integration in iOS
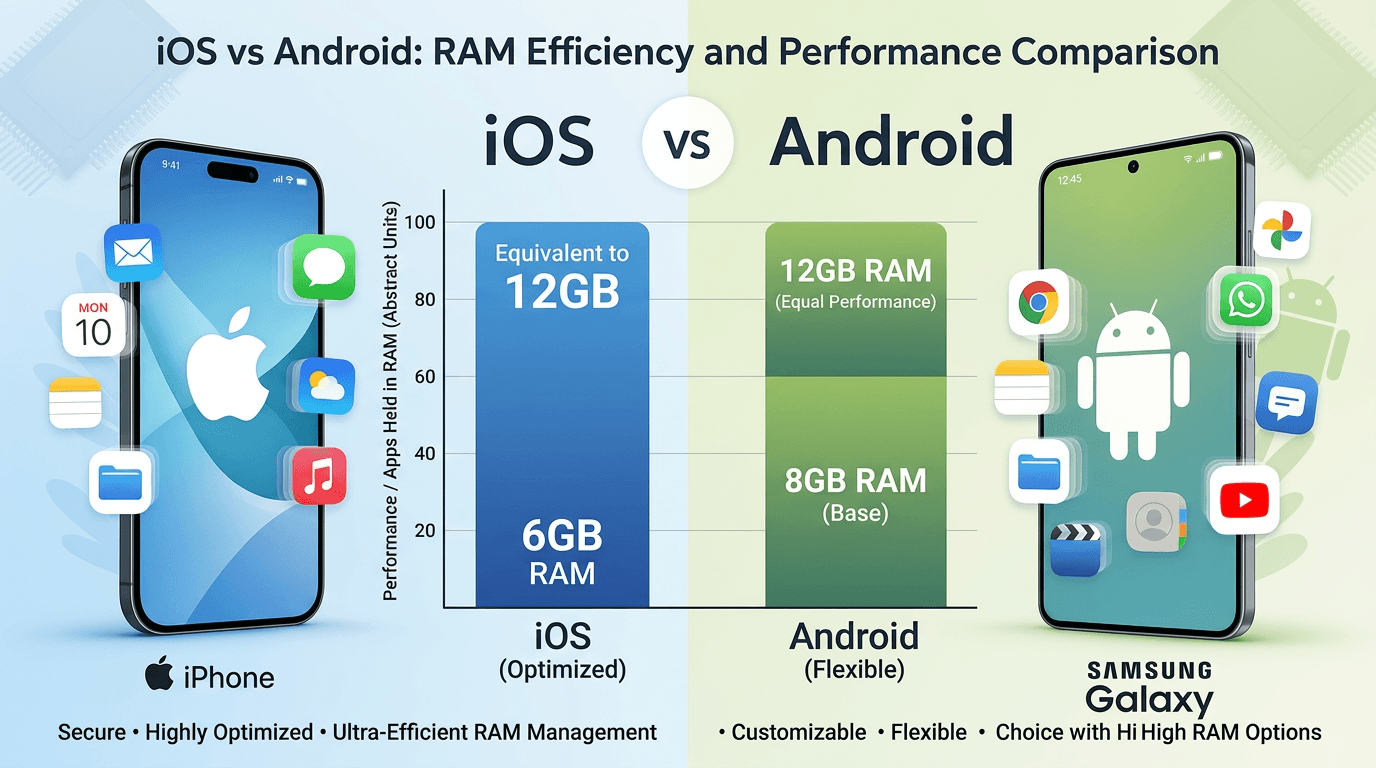
Apple designs its A-series chips and iOS together. This hardware-software integration is exceptionally tight. App launch speed is consistently fast across all supported devices. RAM optimization is superb, with iOS using aggressive memory compression and efficient app suspension. Battery efficiency is excellent because background activity is tightly controlled. An iPhone with 6GB handles multitasking like an Android device with 12GB due to superior RAM management.
Android Device Optimization Challenges
Android must run on chips from Qualcomm, Samsung, MediaTek, and Google. Hardware-software integration varies dramatically across manufacturers. App launch speed ranges from instant on flagships to sluggish on budget devices. RAM optimization is less efficient, requiring more physical RAM to achieve comparable multitasking. Battery efficiency varies widely; some devices excel while others drain quickly due to manufacturer software.
Background Process Handling
iOS allows very limited background execution: playing audio, tracking location, processing VoIP calls, and finishing short tasks. Android offers more flexibility with foreground services, background services, broadcast receivers, and scheduled jobs. This flexibility helps legitimate apps but also allows battery-draining activities that work against battery optimization.
Customization and Flexibility
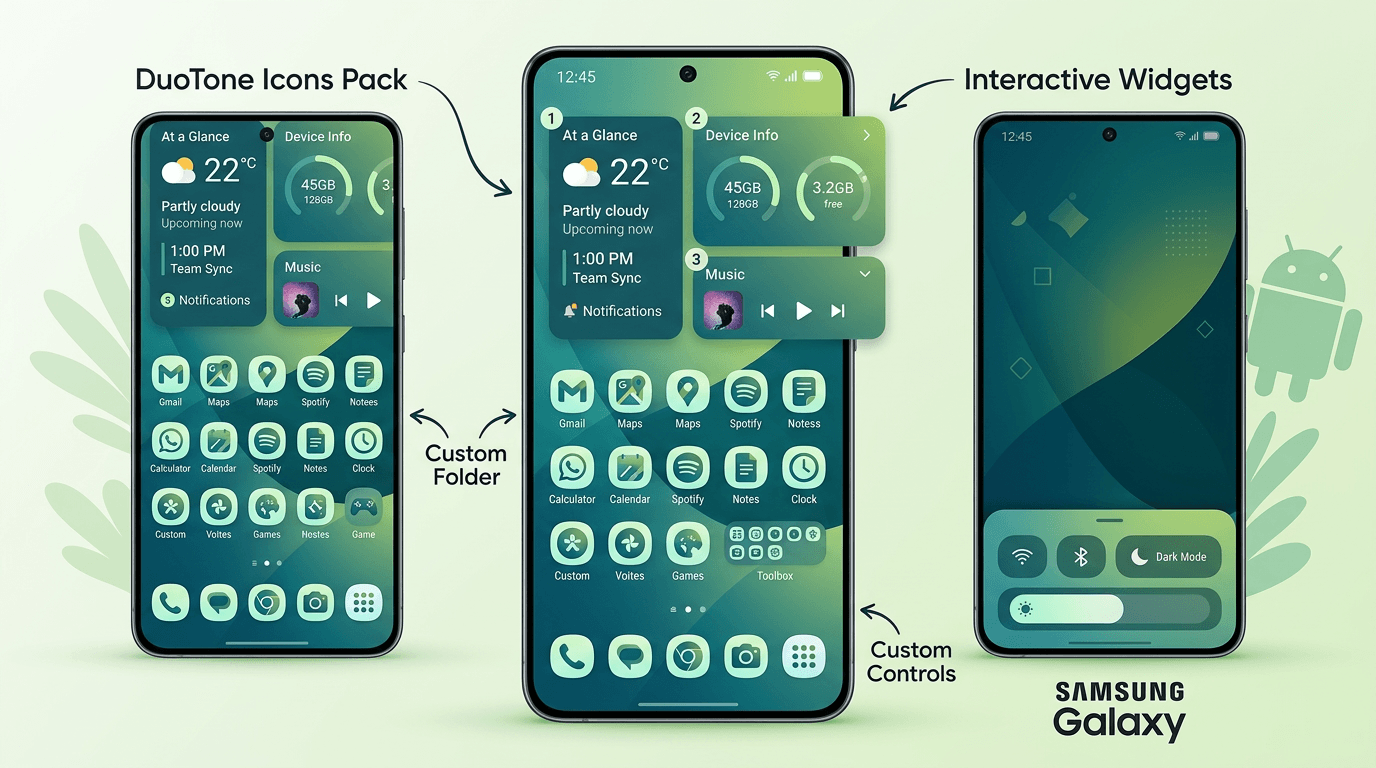
Android Customization Advantages
Android users can change nearly everything. Home screen customization includes launcher replacements, icon packs, custom grids, and scrolling wallpapers. Widget functionality is interactive; widgets can control music, toggle settings, and display live data without opening apps. Default app selection covers browsers, SMS, phone dialer, assistant, and more. File management flexibility allows full access to the file system with any file manager app.
iOS Ecosystem Consistency
Apple values consistency over customization. Home screen customization has improved with iOS 18, including icon tinting, blank spaces, and widget stacking, but remains limited compared to Android. Widget functionality is view-only; tapping a widget opens the associated app. Default app selection now includes browsers, email, and passwords, but many defaults remain Apple-only. Deep system replacement is not allowed.
AI-generated image, please ignore any text errors.Default App Controls
iOS now allows default apps for browser, email, and passwords. Android allows defaults for browser, SMS, phone, dialer, assistant, home launcher, gallery, music player, and more. If you want to replace the phone dialer app on iOS, you cannot. On Android, you can. Better control over user experience is a hallmark of the Android ecosystem.
Cost of App Development
iOS App Development Cost Factors
Building an iOS app costs between $40,000 and $200,000 for a standard production app according to 2025 industry surveys. Maintenance cost runs 15 to 20 percent of initial development annually. Development timeline averages 3 to 4 months for a standard app. Device testing complexity is low; 5 to 8 devices cover most scenarios.
Android App Development Cost Factors
Android development typically costs 15 to 30 percent more than iOS for the same feature set. Initial development cost ranges from $50,000 to $260,000. Maintenance cost runs 20 to 25 percent of initial development annually due to fragmentation. Testing expense adds $10,000 to $30,000 for a device lab. Development timeline averages 4 to 6 months.
Testing Costs
Testing an iOS app requires roughly 10 to 15 physical devices covering the last 5 years of iPhones and iPads. Testing an Android app may require 50 to 100 devices to cover popular manufacturers, screen sizes, Android versions, and chipsets. Cloud testing services such as BrowserStack and Sauce Labs reduce costs but charge monthly fees.
Revenue and Monetization Differences
iOS User Spending Behavior
iOS users spend significantly more on apps, subscriptions, and digital goods. Subscription conversion rate on iOS is higher, with 12-month retention at 35 percent compared to Android's 22 percent. In-app purchase performance is stronger on iOS; 48 percent of iOS users have made an in-app purchase versus 29 percent on Android. Customer lifetime value on iOS is roughly three times higher than Android.
Android Market Reach
Android reaches far more people globally. Advertising revenue potential is higher on Android because more users see ads and tracking is less restricted. Monetization flexibility is higher; developers can use alternative payment systems and distribute outside Google Play. Revenue scalability through volume is Android's strength.
Ecommerce Conversion Trends
Mobile commerce conversion rate runs 3.5 to 4.5 percent on iOS versus 2.5 to 3.5 percent on Android according to Shopify's 2025 Mobile Commerce Report. iOS users also have higher average order values, typically $85 to $120 compared to $55 to $80 on Android. Better business growth strategies include optimizing for iOS if ecommerce is your primary revenue source.
Market Share and Audience Comparison
Global Market Share
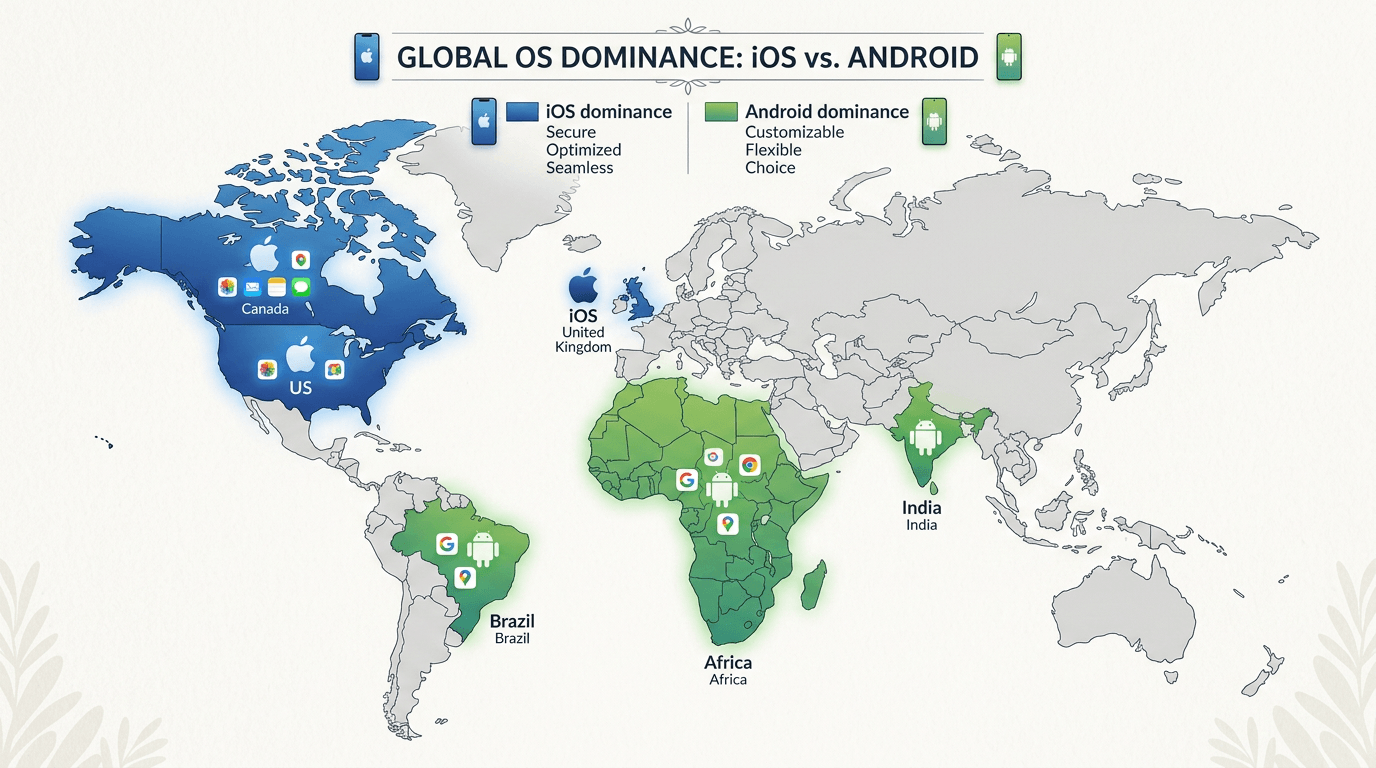
Global market share for Android stands at approximately 72 percent of all smartphones as of early 2026. iOS holds 27 percent. Regional popularity varies dramatically, with Android dominating developing countries and iOS leading wealthy nations. Audience demographics for iOS trend younger, urban, college-educated, and higher income.
iOS Market Presence
iOS dominates in specific countries: 65 percent market share in the United States, 55 percent in Canada, 50 percent in Australia, 45 percent in the United Kingdom, and 40 percent in France and Germany. iOS also leads among high-income user demographics worldwide.
Regional Popularity Differences
Android leads nearly everywhere else: 95 percent in India, 90 percent in Brazil, 85 percent in Indonesia, 80 percent in Nigeria, 75 percent in Mexico, and 70 percent in Turkey and the Philippines. The divide follows economic lines: Android dominates developing markets while iOS leads wealthy nations.
AI-generated image, please ignore any text errors.Business Audience Comparison
Among business professionals, iOS leads in North America and Western Europe. 78 percent of Fortune 500 companies issue iPhones to employees. However, Android dominates small businesses and emerging markets where device cost matters more.
App Maintenance and Updates
iOS Update Rollout Process
Update frequency for iOS is annual major releases with occasional point updates. Version compatibility is excellent; apps targeting the current iOS version reach about 85 percent of devices within four weeks. Maintenance complexity is low because updates behave consistently across all devices. OS fragmentation impact is minimal since nearly all users update quickly. Long-term support extends 6 to 7 years for iPhones.
Android Update Fragmentation
Update frequency varies by manufacturer; Google releases monthly security patches, but device makers decide when to push them. Maintenance complexity is high due to manufacturer customizations and version fragmentation. As of January 2026, Android 15 runs on only 30 percent of devices. Patch deployment speed is inconsistent; Google Pixel devices get timely updates, but many brands delay or skip patches.
Testing Differences Between iOS and Android Apps
iOS Device Testing Scope
Device testing scope for iOS is limited to approximately 25 iPhone models and a handful of iPads. Compatibility testing complexity is low because hardware is consistent. Real-device testing requirements are manageable with 5 to 8 physical devices. Beta testing options through TestFlight support up to 10,000 testers.
Android Testing Complexity
Device testing scope for Android spans thousands of devices from dozens of manufacturers. Compatibility testing complexity is very high, requiring testing across screen sizes, Android versions, chipsets, and manufacturer customizations. Real-device testing requirements ideally include 30 to 50 devices, though cloud services reduce physical needs. Beta testing options through Google Play open tracks allow unlimited testers.
Which Platform Is Better for Businesses?
Startup Considerations
ROI potential for startups favors iOS due to faster time to revenue and higher per-user spending. Time-to-market is shorter on iOS, typically 3 to 4 months versus 4 to 6 months for Android. Brand positioning on iOS carries a premium association. A study of 500 mobile apps by App Radar in 2025 found that iOS-only apps achieved positive ROI in 11 months on average, while Android-only apps took 18 months.
Budget-Based Platform Decisions
If your budget is under $50,000, build iOS only. You get a polished product faster. If you need Android on a tight budget, consider cross-platform development with React Native or Flutter to get both platforms with one codebase. With a budget over $100,000, build native apps for both platforms for the best user experience and long-term maintainability.
Business Growth Strategy
Consider a phased approach: launch iOS first to validate the market and generate early revenue. Use that revenue to fund Android development. By month 8 to 9, launch Android to scale volume. This strategy balances speed, revenue, and reach effectively.
Final Comparison Summary
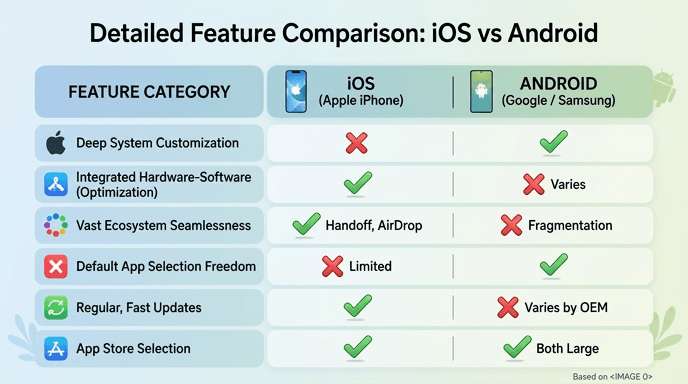
Here is a side-by-side look at the most important differences between iOS and Android apps to support your decision-making.
| Feature | iOS Apps | Android Apps |
|---|---|---|
| Global market share | 27% | 72% |
| Average revenue per user | Higher | Lower |
| Development cost | Lower upfront ($40K–$200K) | Higher upfront ($50K–$260K) |
| Development time | 3–4 months | 4–6 months |
| Device testing needed | 5–8 devices | 30–50+ devices |
| App store fee | $99/year | $25 one time |
| Approval time | 24–48 hours | Hours to days |
| Customization | Limited | Extensive |
| Security | Very high | Moderate |
| Update adoption | 85% in 4 weeks | Fragmented |
| Best for | Premium, paid apps | Volume, free apps |
Frequently Asked Questions
iOS is easier for most developers due to fewer devices, consistent updates, and better documentation. Xcode provides an excellent developer experience for simple and complex apps alike. Android Studio is also capable, but Android's fragmentation means more testing work and compatibility concerns that extend development time.
Generally yes. iOS apps have fewer vulnerabilities, face less malware, and receive faster security patches. Both platforms are safe for typical users who stick to official stores. The greatest Android risk comes from sideloading apps outside of Google Play. Your own behavior matters more than the platform choice.
iOS generates more revenue overall and per user. In 2025, the Apple App Store generated $86 billion compared to Google Play Store's $48 billion. iOS excels for subscription and paid apps. Android excels for ad-supported models and volume-driven revenue at global scale.
Not without modification. Cross-platform tools like React Native and Flutter allow shared codebases and deploy to both platforms, typically achieving 70–95% code reuse. However, true native apps require separate versions written in Swift for iOS and Kotlin for Android. Many apps you use daily are built with cross-platform tools.
Android has more users: approximately 3.8 billion active devices versus 1.6 billion iPhones globally. iOS leads in wealthy nations like the US, UK, Canada, and Australia. Android dominates everywhere else, especially in South and Southeast Asia, Latin America, and Africa. Check regional data rather than global averages when making your decision.
iOS-first launches happen because iOS users spend more, development is faster, and testing is simpler. This pattern has worked for Instagram, Uber, and countless others. Startups use iOS launch revenue to fund their Android development, then expand to reach a larger global audience.
Build native apps when you have the budget, need peak performance, or rely heavily on platform-specific features like ARKit, CoreML, or Bluetooth LE. Choose cross-platform (React Native or Flutter) when your budget is under $80,000, your app has simple UI, you need both platforms launched simultaneously, or you are building a prototype or MVP.